


Este artículo también está disponible en español.
Crypto analyst Egrag has provided an historical analysis of the weekly XRP price chart, suggesting that the cryptocurrency is entering “uncharted territory.” Utilizing historical data and focusing on critical technical indicators.
Egrag highlights significant shifts in XRP’s trading behavior, emphasizing the exhaustion felt by the XRP community during this prolonged cycle. “This cycle has been extremely exhausting and super manipulative, especially when it comes to XRP. But don’t lose hope!” he states.
Why XRP Is In Uncharted Territory
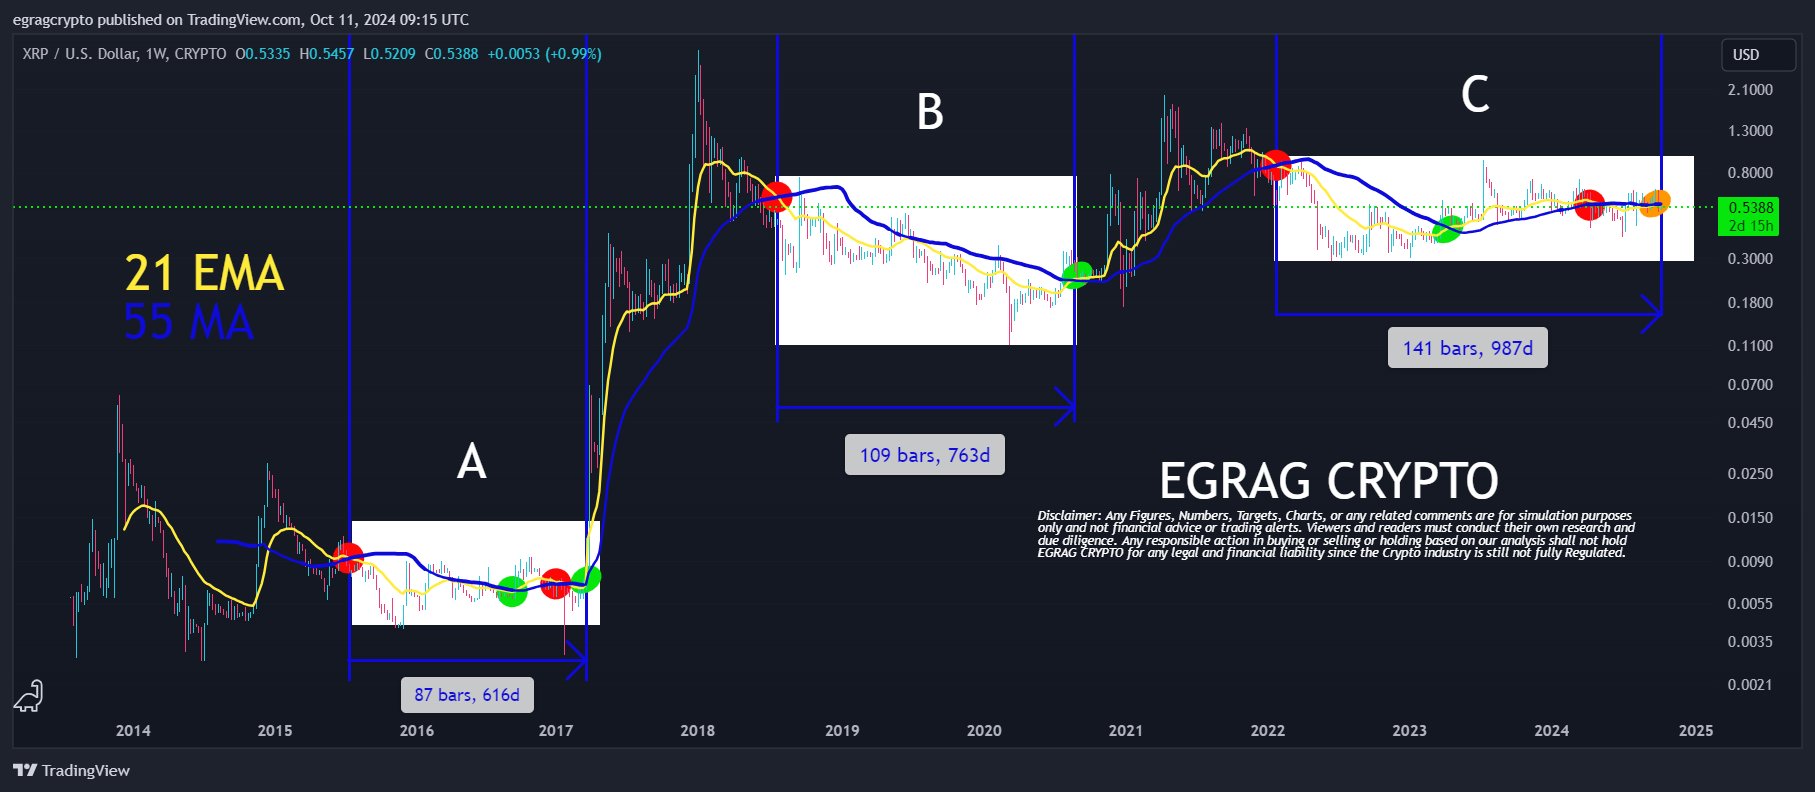
Central to Egrag’s analysis are two key indicators plotted on a weekly scale: the 21-week Exponential Moving Average (EMA) and the 55-week Simple Moving Average (MA). Both indicators are renowned for their responsiveness to price changes and have historically been indicative of market momentum shifts for XRP. The interactions between these moving averages, particularly when they cross, are pivotal in forecasting potential bullish or bearish trends.
Related Reading
Egrag identifies three types of crosses in his analysis, each signaling different market sentiments. A bearish cross, marked by a red circle on his chart, occurs when the 21-week EMA crosses below the 55-week MA, indicating potential downward momentum. A bullish cross, denoted by a green circle, happens when the 21-week EMA crosses above the 55-week MA, signaling possible upward movement. An indecisive cross, represented by an orange circle, marks periods where the moving averages converge but do not decisively cross, reflecting uncertainty or possible market manipulation.
In Cycle A, XRP experienced a bearish cross followed by two bullish crosses, with significant implications for its price trajectory. The period from the bearish cross to the first bullish cross spanned approximately 616 days, during which the market sentiment gradually shifted. Midway through this cycle, there was another bearish cross about 140 days after the first bullish cross, preceding the second bullish cross that occurred 49 days later. This second bullish cross led to an explosive price movement. Egrag remarks, “We had a bearish cross, followed by two bullish crosses—one midway through the cycle and the second was explosive!
Related Reading
Cycle B presented a different scenario, featuring one bearish cross followed by one bullish cross. The duration from the bearish to the bullish cross was approximately 763 days, indicating a prolonged period of bearish sentiment before the market shifted. During this cycle, XRP narrowly missed an earlier bullish cross due to a significant price dump, which prevented the moving averages from crossing as they might have otherwise. “Mid-cycle, XRP narrowly missed the bullish cross due to a major price dump,” notes Egrag.
Currently, in Cycle C, XRP is exhibiting behavior that differs from the previous cycles both in duration and complexity. From the first bearish cross to the first bullish cross, the cycle lasted about 441 days, longer than in prior cycles. Subsequently, there was a period of 399 days leading to a second bearish cross. In total, Cycle C has spanned approximately 987 days from the first bearish cross, making it the longest cycle since XRP’s inception.
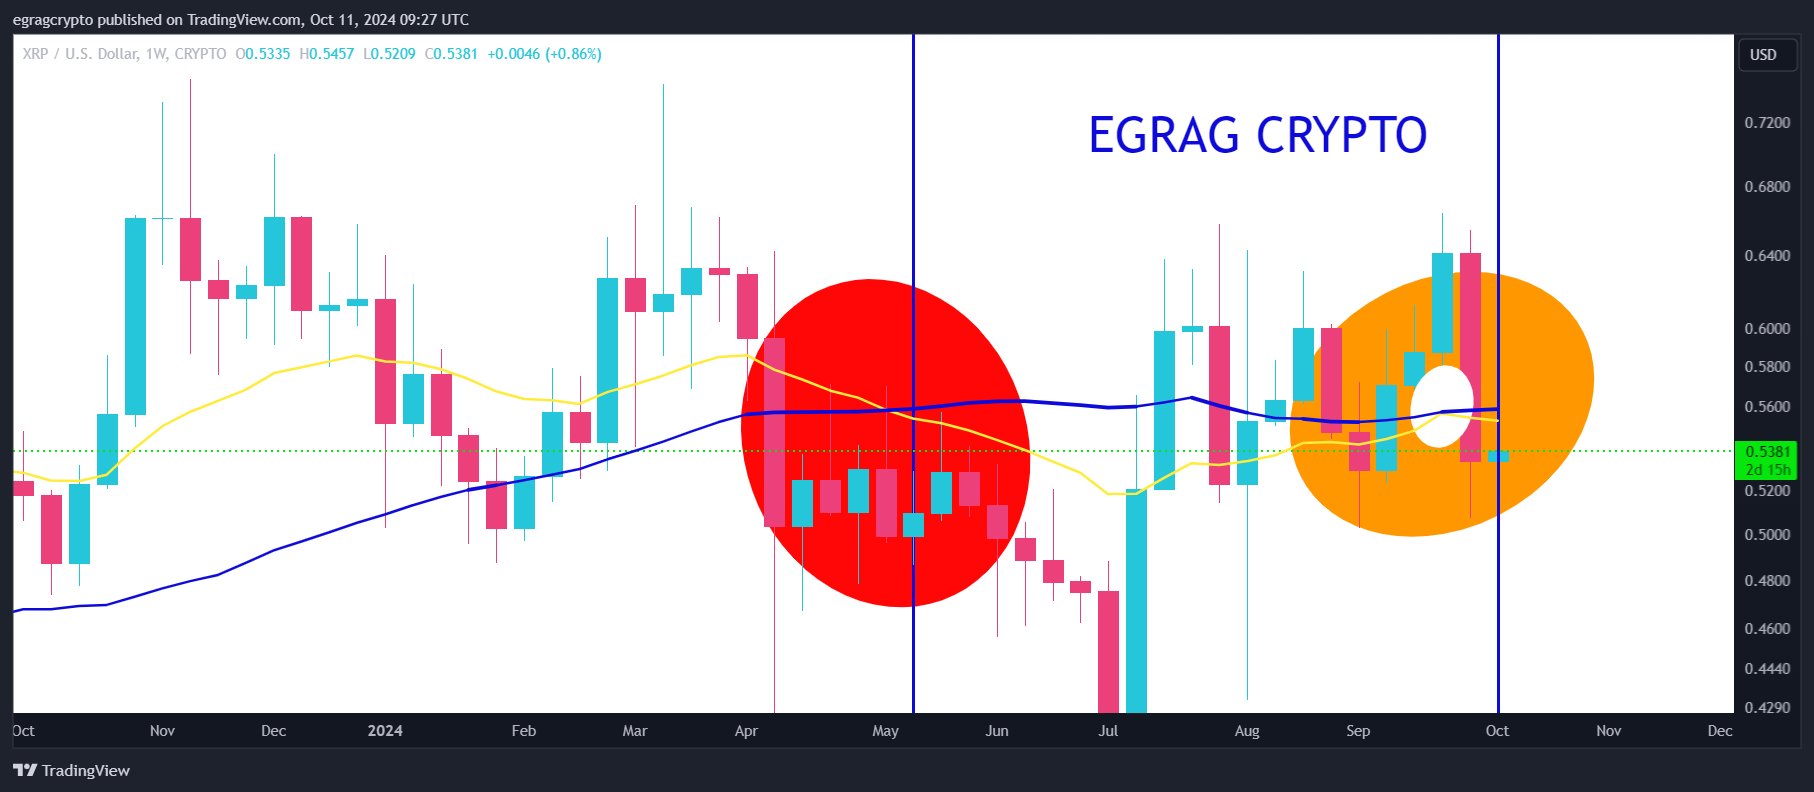
At present, the 21-week EMA and the 55-week MA are converging but have not decisively crossed, marked by an orange circle indicating an indecisive cross. Egrag expresses frustration at this development, stating, “Right now, both indicators (21 EMA & 55 MA) are in the orange circle—right on the verge of a manipulated bullish cross that we narrowly avoided. This is pure manipulation! ”
Egrag’s analysis suggests that Cycle C’s unprecedented duration and deviation from previous patterns place XRP in “uncharted territory,” indicating that the market may be poised for an outcome not previously observed. “After breaking down all these crosses, my takeaway is that Cycle C is different from Cycles A & B based on the number of crosses and duration. We’re in uncharted territory, so we’re likely to witness something new this time,” he asserts.
However, Egrag remains optimistic about the future. He envisions the potential onset of a ‘utility phase’ for XRP, where the focus shifts from speculative trading to practical applications of the cryptocurrency. “In my optimistic view, I hope this is the moment the utility phase kicks in, allowing us to use our XRP instead of selling it!” he concludes.
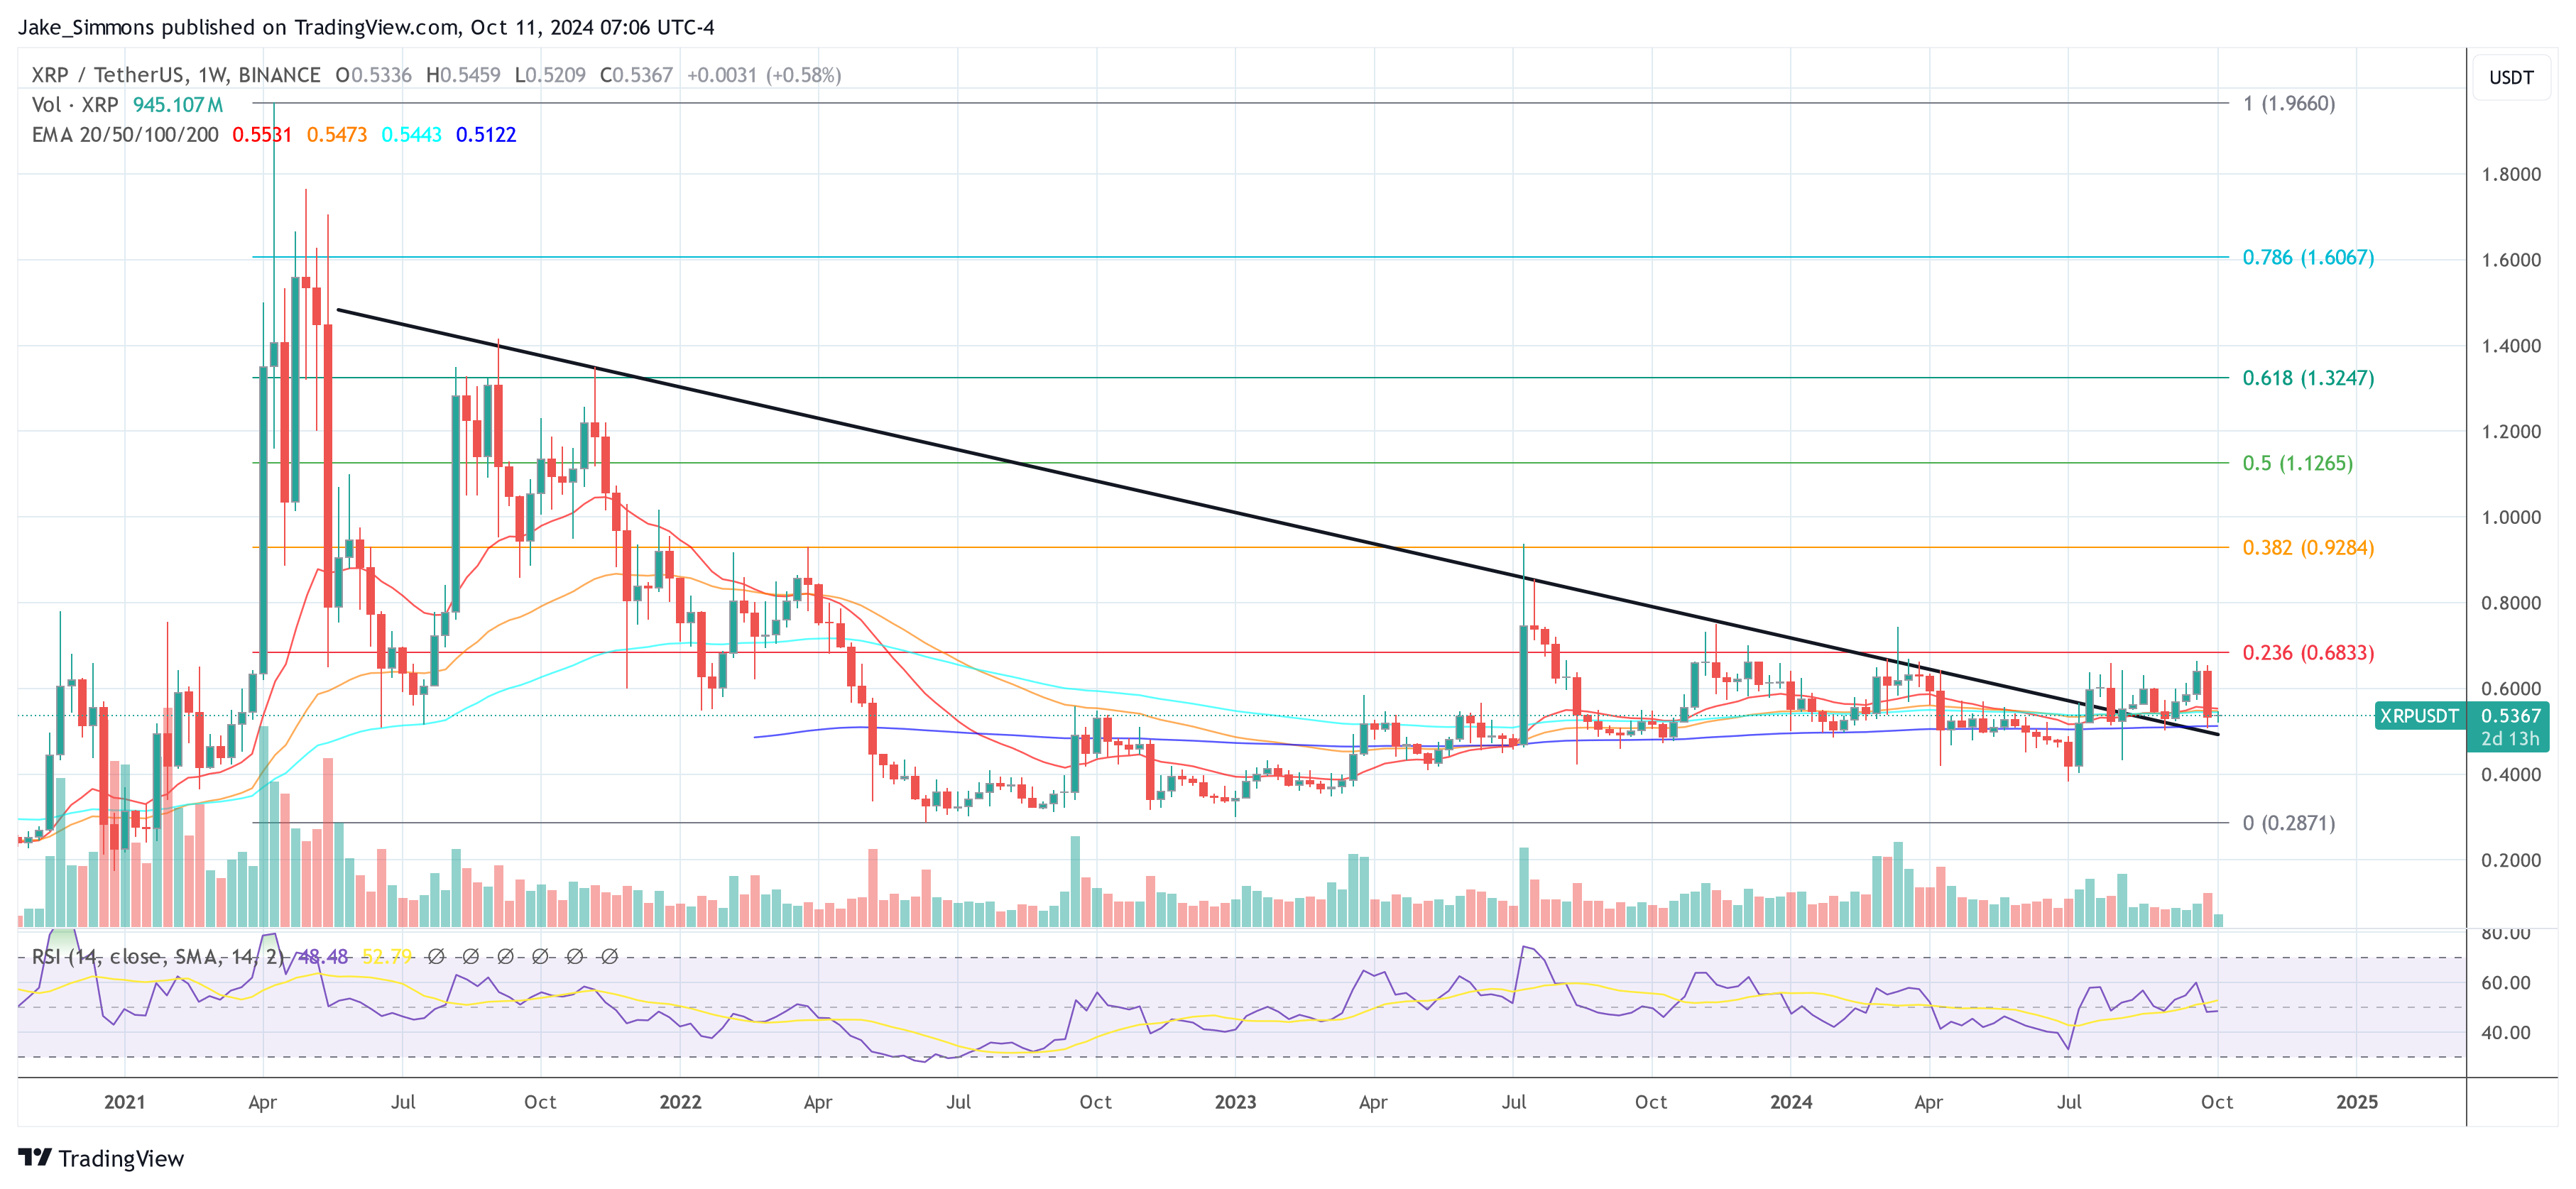
At press time, XRP traded at $0.53.
Featured image created with DALL.E, chart from TradingView.com
Credit: Source link


