• Live Crypto Prices
  • Crypto News
    • Worldwide
      • Bitcoin
      • Ethereum
      • Altcoin
      • Blockchain
      • Regulation
    • Australian Crypto News
  • Education
    • Cryptocurrency For Beginners
    • Where to Buy Cryptocurrency
    • Where to Store Cryptos
    • Cryptocurrency Tax in Australia 2021
No Result
View All Result
CryptoABC.net
No Result
View All Result

Will The Bitcoin Price Move Above $110,000 Again? Global M2 Money Supply Shows What’s Next

June 16, 2025
in Bitcoin
Reading Time: 4min read
0 0
A A
0
Will The Bitcoin Price Move Above $110,000 Again? Global M2 Money Supply Shows What’s Next
0
SHARES
0
VIEWS
ShareShareShareShareShare

Reason to trust

Strict editorial policy that focuses on accuracy, relevance, and impartiality

Created by industry experts and meticulously reviewed

The highest standards in reporting and publishing

Strict editorial policy that focuses on accuracy, relevance, and impartiality

Morbi pretium leo et nisl aliquam mollis. Quisque arcu lorem, ultricies quis pellentesque nec, ullamcorper eu odio.

Bitcoin’s current trading range is all part of a consolidation move before a return above $110,000. Although the leading cryptocurrency has largely held above the $105,000 support zones in recent days, its rally has taken a hit in the past two weeks. 

Technical analysis of Bitcoin’s price action, when overlapped with the Global M2 Money Supply metric, shows that it is only a matter of time before it enters into a new all-time high.

Global M2 Offset Models Says Something Interesting

According to a detailed post by crypto analyst Colin, also known as “The M2 Guy,” on the social media platform X, Bitcoin’s price action appears to be tracking the global M2 money supply with a high degree of correlation when the data is offset by 68 to 76 days.

Related Reading

Two separate charts presented by Colin reveal this trend vividly, showing how Bitcoin price movements have followed the trajectory of the Global M2 Money Supply when adjusted for time. The short-term 68-day offset chart aligns closely with Bitcoin’s behavior since April 2025, while the 76-day offset chart offers a longer-term view of the relationship. 

Bitcoin
Source: Colin on X

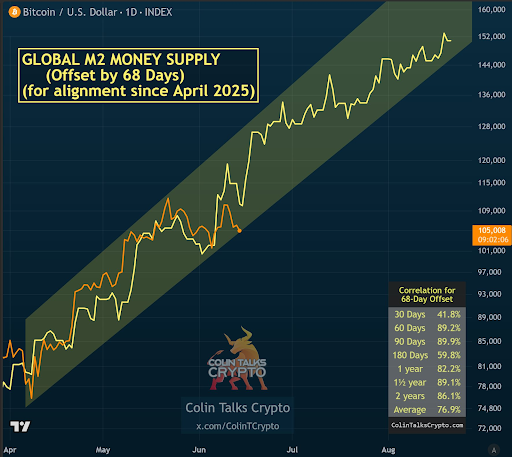
In both cases, the analyst highlighted that the M2 curve is pointing upward, where Bitcoin has yet to play out, implying a similarly bullish trajectory for its price action. Colin describes this as a form of confluence, noting that when two correlated indicators show the same directional outcome, the probability of that outcome increases. Particularly, the average correlation across both charts is around 76.6 to 76.9%, both of which are very high and lend statistical weight to the prediction.

What Does This Mean For Bitcoin Price?

The 68-day offset chart shows Bitcoin trailing the M2 curve with high precision since April, with the highest 89.9% degree of accuracy on the 90-day timeframe. Similarly, the 76-day offset, while less accurate in the short term, displays a strong correlation over longer intervals of 92.2% over one and a half years and 86.2% across two years. These correlation values shows that Bitcoin is increasingly sensitive to global liquidity trends, especially now that its price movement is tied to inflows/outflows surrounding Spot Bitcoin ETFs. 

Related Reading

This relationship becomes even more notable considering the M2 money supply itself has been climbing within a rising channel. If the alignment continues, Bitcoin may soon follow suit, lifting it back above the $110,000 level and breaking above its all-time high. Bitcoin’s price action will be very interesting to follow in the next few days. In Colin’s view, this next move up is not only likely but could happen within days.

If Bitcoin follows this alignment, the projection shows that Bitcoin will continue to move within a channel of higher highs and higher lows before eventually crossing above $150,000 in August. At the time of writing, Bitcoin is trading at $106,549, up by 1% in the past 24 hours.

Bitcoin
BTC trading at $106,976 on the 1D chart | Source: BTCUSDT on Tradingview.com

Featured image from Getty Images, chart from Tradingview.com

Credit: Source link

ShareTweetSendPinShare
Previous Post

$8 Dogecoin? Analyst Says You’ll Regret Sleeping On This Chart

Next Post

Analyst Sees Ethereum (ETH) Igniting 60% Rally Despite Dip, Says Final Major Resistance for Bitcoin (BTC) Getting Weaker

Next Post
Ethereum Whales Gobble Up 1,700,000 ETH in Just 30 Days, Signaling Confidence: IntoTheBlock

Analyst Sees Ethereum (ETH) Igniting 60% Rally Despite Dip, Says Final Major Resistance for Bitcoin (BTC) Getting Weaker

Leave a Reply Cancel reply

Your email address will not be published. Required fields are marked *

You might also like

Ethereum Price Could Rally To $10,000 If This Major Resistance Is Broke

Ethereum Price Could Rally To $10,000 If This Major Resistance Is Broke

June 13, 2025
Dogecoin Must Hold This Support Or Risk Crashing To $0.015

Bitcoin Rally Could End in Tears

June 15, 2025
Trident Digital Tech Eyes $500M XRP Treasury as Shares Plunge Over 30%

Trident Digital Tech Eyes $500M XRP Treasury as Shares Plunge Over 30%

June 13, 2025
Stablecoins To Hit $2 Trillion? US Treasury Hints At Explosive Growth

Stablecoins To Hit $2 Trillion? US Treasury Hints At Explosive Growth

June 13, 2025
Crypto Exchange Backed by Peter Thiel Confidentially Files for IPO With SEC: Report

Crypto Exchange Backed by Peter Thiel Confidentially Files for IPO With SEC: Report

June 12, 2025
Trader Weights In On Crypto Cycle

Ethereum Prepares For Breakout After $2.8K, What’s Next?

June 12, 2025
CryptoABC.net

This is an Australian online news/education portal that aims to provide the latest crypto news, real-time updates, education and reviews within Australia and around the world. Feel free to get in touch with us!

What's New Here!

Key Fractal From 2023 Says Bitcoin Price Is Still Bullish, But A Crash To $90,000 Could Be Coming

Key Fractal From 2023 Says Bitcoin Price Is Still Bullish, But A Crash To $90,000 Could Be Coming

June 16, 2025
PEPE Pumps 2.67% – Is The Memecoin Preparing For A Major Rebound?

PEPE Pumps 2.67% – Is The Memecoin Preparing For A Major Rebound?

June 16, 2025

Subscribe Now

  • Contact Us
  • Privacy Policy
  • Terms of Use
  • DMCA

© 2021 cryptoabc.net - All rights reserved!

No Result
View All Result
  • Live Crypto Prices
  • Crypto News
    • Worldwide
      • Bitcoin
      • Ethereum
      • Altcoin
      • Blockchain
      • Regulation
    • Australian Crypto News
  • Education
    • Cryptocurrency For Beginners
    • Where to Buy Cryptocurrency
    • Where to Store Cryptos
    • Cryptocurrency Tax in Australia 2021

© 2021 cryptoabc.net - All rights reserved!

Welcome Back!

Login to your account below

Forgotten Password?

Create New Account!

Fill the forms below to register

All fields are required. Log In

Retrieve your password

Please enter your username or email address to reset your password.

Log In
  • Heart NumberHeart Number(HTN)$0.000000-30.47%
  • TadpoleTadpole(TAD)$0.000000-1.76%
  • SEENSEEN(SEEN)$0.000000-2.27%
  • EvedoEvedo(EVED)$0.000000-0.80%
  • MarginswapMarginswap(MFI)$0.000000-2.17%
  • SakeTokenSakeToken(SAKE)$0.0000004.37%
  • WTF TokenWTF Token(WTF)$0.0000000.16%
  • BNSD FinanceBNSD Finance(BNSD)$0.000000-5.83%
  • RobotinaRobotina(ROX)$0.00000038.50%
  • CageCage(C4G3)$0.000000-3.67%