Seasoned trader Peter Brandt is expressing bearish sentiment on Bitcoin (BTC) as the flagship crypto asset’s price hovers about 10% below the all-time high reached three months ago.
Brandt tells his 729,100 followers on the social media platform X that Bitcoin is exhibiting a bearish chart pattern on the daily time frame.
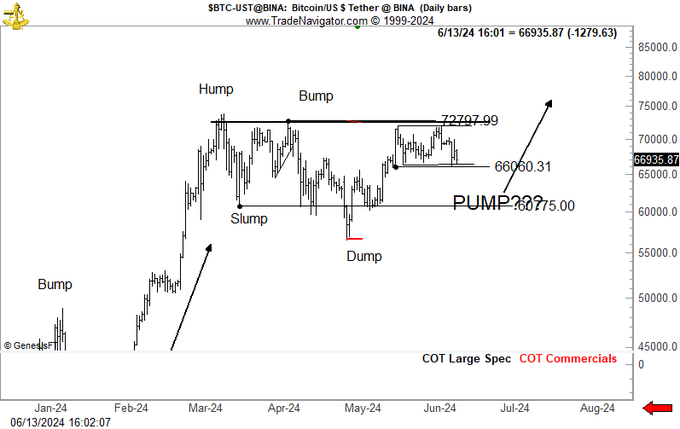
Based on Brandt’s chart depicting the “Bump, Hump, Slump, Bump, Dump” pattern, the veteran trader seems to suggest that Bitcoin’s closest support level is around $65,060 and the second-closest one is at $60,775.
The “Bump, Hump, Slump, Bump, Dump” pattern consists of an initial increase in price, a “Bump” that indicates bullish momentum. The bump in price is followed by a “Hump” which consists of a consolidation phase and then followed by a “Slump,” which denotes a price decline. A “Slump” precedes another “Bump” which in turn gives rise to a “Dump”.
According to Brandt, Bitcoin’s next course of action is most likely a downward movement.
“Sometimes the most obvious interpretations of a chart work out, most of the time the charts morph. But the most obvious is this:
Break through $65,000, then market goes to $60,000.
Break through $60,000 market goes to $48,000.”

Bitcoin is trading at $66,276 at time of writing.
The veteran trader also says that Bitcoin is exhibiting decreasing rates of return and this could mean that BTC has already reached the current cycle’s top.
“While only few data points, past bull market cycles measured as percent gains from low to high have decayed:
2011-2013 lost 82% of the power of the 2010-2011 move
2015-2017 lost 79% of the power of the 2011-2013 move
2018-2021 lost 82% of the power of the 2015-2017 move
If decay continues, 2022-2024 advance may be complete.”
Generated Image: DALLE3
Credit: Source link


