• Live Crypto Prices
  • Crypto News
    • Worldwide
      • Bitcoin
      • Ethereum
      • Altcoin
      • Blockchain
      • Regulation
    • Australian Crypto News
  • Education
    • Cryptocurrency For Beginners
    • Where to Buy Cryptocurrency
    • Where to Store Cryptos
    • Cryptocurrency Tax in Australia 2021
No Result
View All Result
CryptoABC.net
No Result
View All Result

This Ethereum Monthly RSI Chart Just Crashed To New Lows To Break 2022 Records, What Happened Last Time?

March 12, 2025
in Bitcoin
Reading Time: 4min read
0 0
A A
0
0
SHARES
12
VIEWS
ShareShareShareShareShare

Reason to trust

Strict editorial policy that focuses on accuracy, relevance, and impartiality

Created by industry experts and meticulously reviewed

The highest standards in reporting and publishing

Strict editorial policy that focuses on accuracy, relevance, and impartiality

Morbi pretium leo et nisl aliquam mollis. Quisque arcu lorem, ultricies quis pellentesque nec, ullamcorper eu odio.

Este artículo también está disponible en español.

Ethereum’s price has been facing significant downward pressure in recent days, with the cryptocurrency even dipping below the $2,000 mark for the first time since December 2023. The crash below $2,000 has done more harm to the already declining bullish sentiment, and the next outlook is whether there will be more incoming declines or whether the leading altcoin is already nearing a bottom. 

Notably, an interesting signal of a probable outcome has been revealed through the Ethereum CME Futures chart, where the monthly Relative Strength Index (RSI) just reached its lowest level on record, surpassing the readings from the 2022 bear market.

Ethereum’s Monthly RSI Drops Below 2022 Levels

Crypto analyst Tony “The Bull” Severino has highlighted a significant development in Ethereum’s technical indicators, pointing out that the cryptocurrency’s monthly Relative Strength Index (RSI) on the CME Futures chart has now fallen to its lowest level on record.

Related Reading

This decline has pushed the RSI below the 2022 bear market bottom, a period that saw Ethereum reach multi-year lows before eventually staging a recovery. Severino shared this observation in a detailed technical analysis post on social media platform X, using Ethereum’s Futures monthly candlestick timeframe chart. 

Ethereum
Source: Tony Severino on X

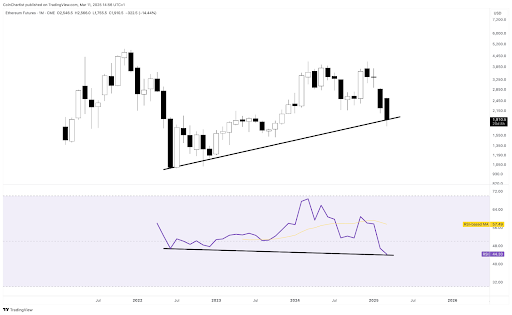
The analyst noted that although this drop suggests strong selling momentum, it could also be forming a hidden bullish divergence. This is because the last time Ethereum’s RSI dropped to such extreme lows, it eventually found its footing around $900 and embarked on a price uptrend in the months that followed. This previous performance raises the possibility of Ethereum approaching a bottom, despite its current downward momentum. It is possible that Ethereum has now found a footing around $1,900 and is now gearing up for another uprend in the coming months.

However, Severino remained cautious about the situation, stating that the reading could also mean that the selling pressure is at its strongest and could continue driving Ethereum lower into oversold conditions. Interestingly, he also made it clear that despite the potential for a reversal, he is currently leaning more toward a bearish outlook on Ethereum.

Stochastic Indicator Points To A Deeper Bearish Phase

Beyond the RSI levels, another key indicator that Severino highlighted is Ethereum’s one-month Stochastic oscillator, which has now dropped below the 50 mark. In a previous analysis, he noted that Ethereum’s drop below the 50 mark is characteristic of a bear maket territory. However, it typically does not find a bottom until the Stochastic indicator reaches below 20 and is in extreme oversold conditions.

Related Reading

As shown by the chart below, past trends indicate that when Ethereum’s Stochastic oscillator enters bear market territory, it often takes months before the asset stabilizes and begins a strong recovery.

At the time of writing, Ethereum is trading at $1,920, having recently reached a low of $1,851 in the past 24 hours.

Ethereum
ETH trading at $1,891 on the 1D chart | Source: ETHUSDT on Tradingview.com

Featured image from Unsplash, chart from Tradingview.com

Credit: Source link

ShareTweetSendPinShare
Previous Post

CBDCs ‘Obvious Tool for Financial Surveillance’ Against Americans, Says Congressman Emmer Amid New Stablecoin Bill

Next Post

Bitcoin Lost And Retested The 200-Day MA As Resistance – Here’s What Happened Last Time

Next Post
Bitcoin Lost And Retested The 200-Day MA As Resistance – Here’s What Happened Last Time

Bitcoin Lost And Retested The 200-Day MA As Resistance – Here’s What Happened Last Time

You might also like

Bitcoin Hovers Around $70K as Weak Demand and Defensive Positioning Signal Fragile Market, Says Glassnode

Bitcoin Hovers Around $70K as Weak Demand and Defensive Positioning Signal Fragile Market, Says Glassnode

March 6, 2026
Understanding the Role and Capabilities of AI Agents

LangChain Skills Boost Claude Code Performance From 17% to 92% on AI Tasks

March 4, 2026
Strange New Chinese AI ‘KIMI’ Predicts the Price of XRP, Ethereum and Dogecoin by the End of 2026

Strange New Chinese AI ‘KIMI’ Predicts the Price of XRP, Ethereum and Dogecoin by the End of 2026

March 5, 2026
Bitcoin Bounce Fails As Short-Term Holders Rush To Take Profit

Bitcoin Bounce Fails As Short-Term Holders Rush To Take Profit

March 7, 2026
Institutional Accumulation: US Bitcoin ETFs and MicroStrategy Drive $1.2B Demand Surge

Institutional Accumulation: US Bitcoin ETFs and MicroStrategy Drive $1.2B Demand Surge

March 4, 2026
Bitcoin’s Brief Rally Isn’t The End Of The Bear Market: Analysts

Bitcoin’s Brief Rally Isn’t The End Of The Bear Market: Analysts

March 7, 2026
CryptoABC.net

This is an Australian online news/education portal that aims to provide the latest crypto news, real-time updates, education and reviews within Australia and around the world. Feel free to get in touch with us!

What's New Here!

Bitcoin Worth Nearly $12 Million Moved By Bhutan In Fresh On-Chain Activity

Bitcoin Worth Nearly $12 Million Moved By Bhutan In Fresh On-Chain Activity

March 11, 2026
Hyperliquid Jumps Following Margin Upgrade and 533% Oil Trading Surge

Hyperliquid Jumps Following Margin Upgrade and 533% Oil Trading Surge

March 11, 2026

Subscribe Now

  • Contact Us
  • Privacy Policy
  • Terms of Use
  • DMCA

© 2021 cryptoabc.net - All rights reserved!

No Result
View All Result
  • Live Crypto Prices
  • Crypto News
    • Worldwide
      • Bitcoin
      • Ethereum
      • Altcoin
      • Blockchain
      • Regulation
    • Australian Crypto News
  • Education
    • Cryptocurrency For Beginners
    • Where to Buy Cryptocurrency
    • Where to Store Cryptos
    • Cryptocurrency Tax in Australia 2021

© 2021 cryptoabc.net - All rights reserved!

Welcome Back!

Login to your account below

Forgotten Password?

Create New Account!

Fill the forms below to register

All fields are required. Log In

Retrieve your password

Please enter your username or email address to reset your password.

Log In
Please enter CoinGecko Free Api Key to get this plugin works.