


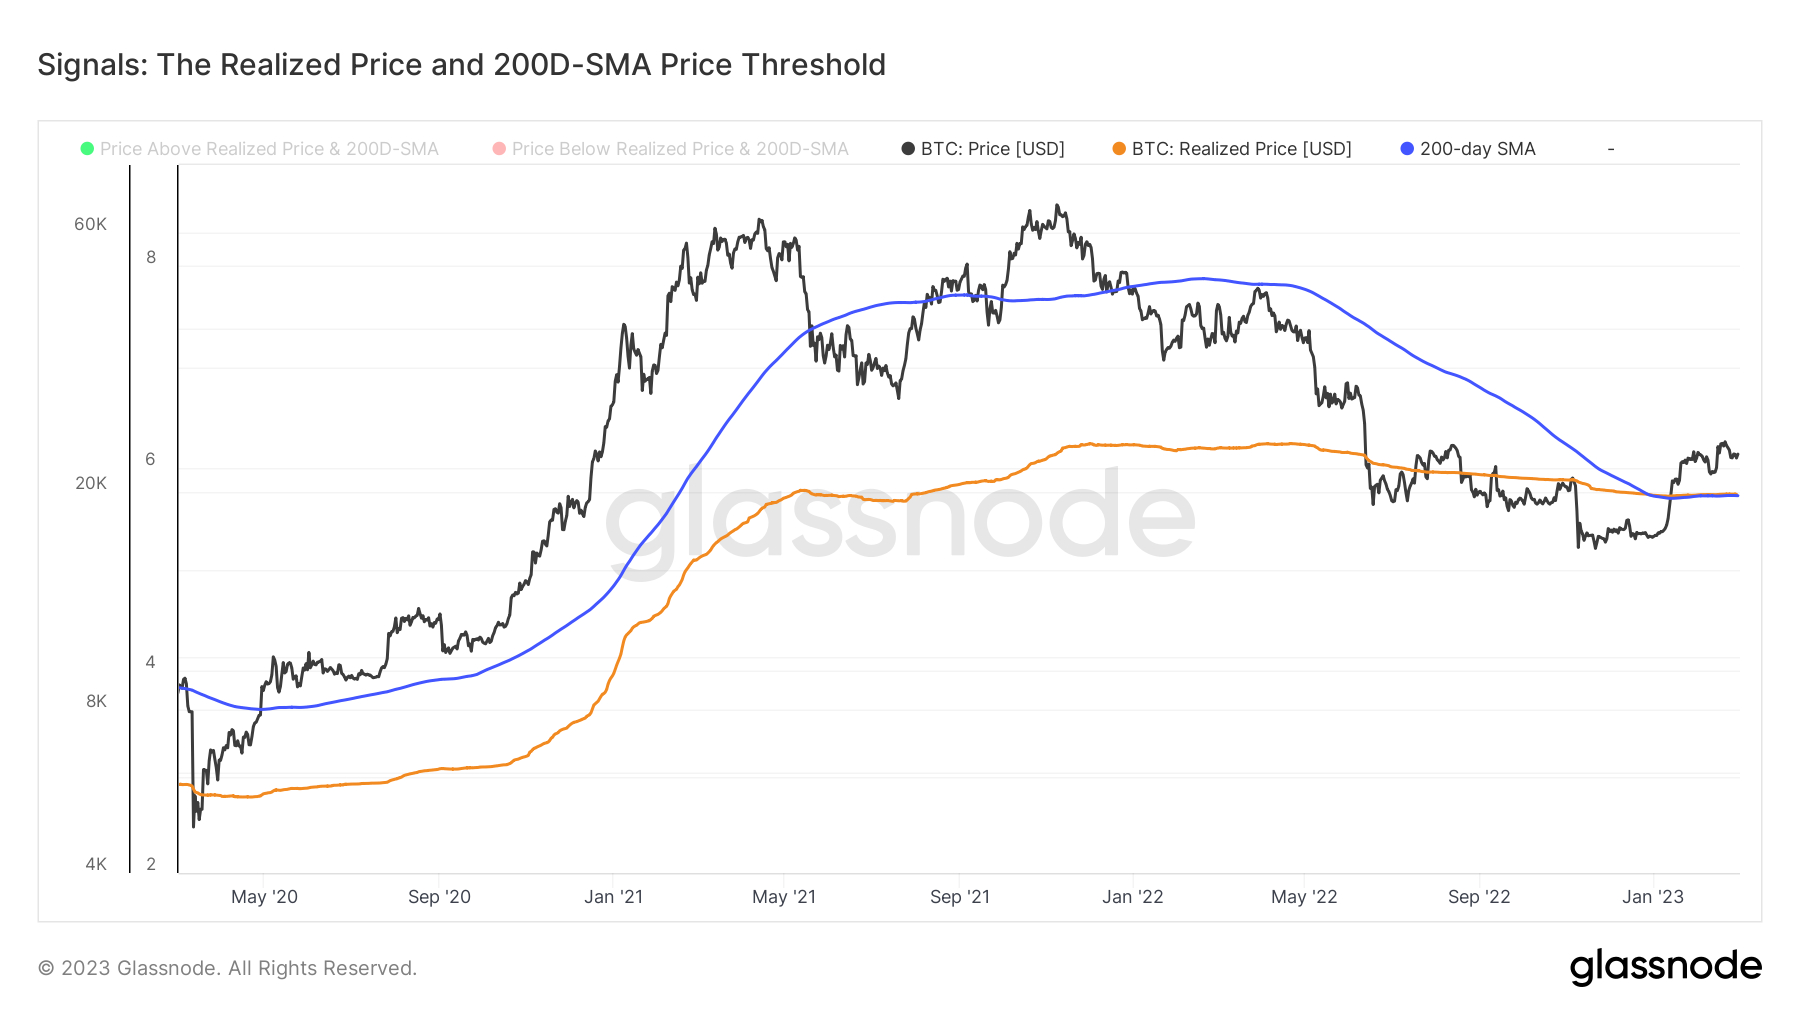
Bitcoin’s ferocious January price rally launched much of the market back into profitability for the first-time months. The Bitcoin market’s return to profitability is seen in the resurgence in the price, last at around $23,500, above the so-called “Realized Price”, which is the average BTC price at the time when each BTC token last moved.
Bitcoin’s Realized Price was last around $19,850, according to data presented by crypto analytics firm Glassnode. Technicians view a break above the Realized Price as a signal of a meaningful shift in the market’s medium-term momentum, much how they view a break above or below the 200-Day Moving Averages (which Bitcoin also recently broke decisively above).
But the Bitcoin price’s relationship to its Realized Price and what this means for the market outlook is far more nuanced. That’s according to analysts at Glassnode, who present a number of more advanced models that look at the differential between the Bitcoin price and Realized price to determine whether the market is reaching a top or bottom, or about to embark on a prolonged bull or bear market.
And these metrics are sending a unified signal. The medium-long term outlook for the Bitcoin market is looking good, if history is anything to go by.
MVRV Ratio is Recovering From Historically Significant Low Levels
Glassnode presents a metric called the Market Value Realized Value (MVRV) Ratio – A ratio between the current market, or spot, price, and the Realized Price. They then introduce ratio levels that they deem as suggesting the market is at an extreme – 0.8 and 1.0, below which the market is viewed as extremely weak, and 2.4 and 3.2, above which the market is viewed as extremely strong.
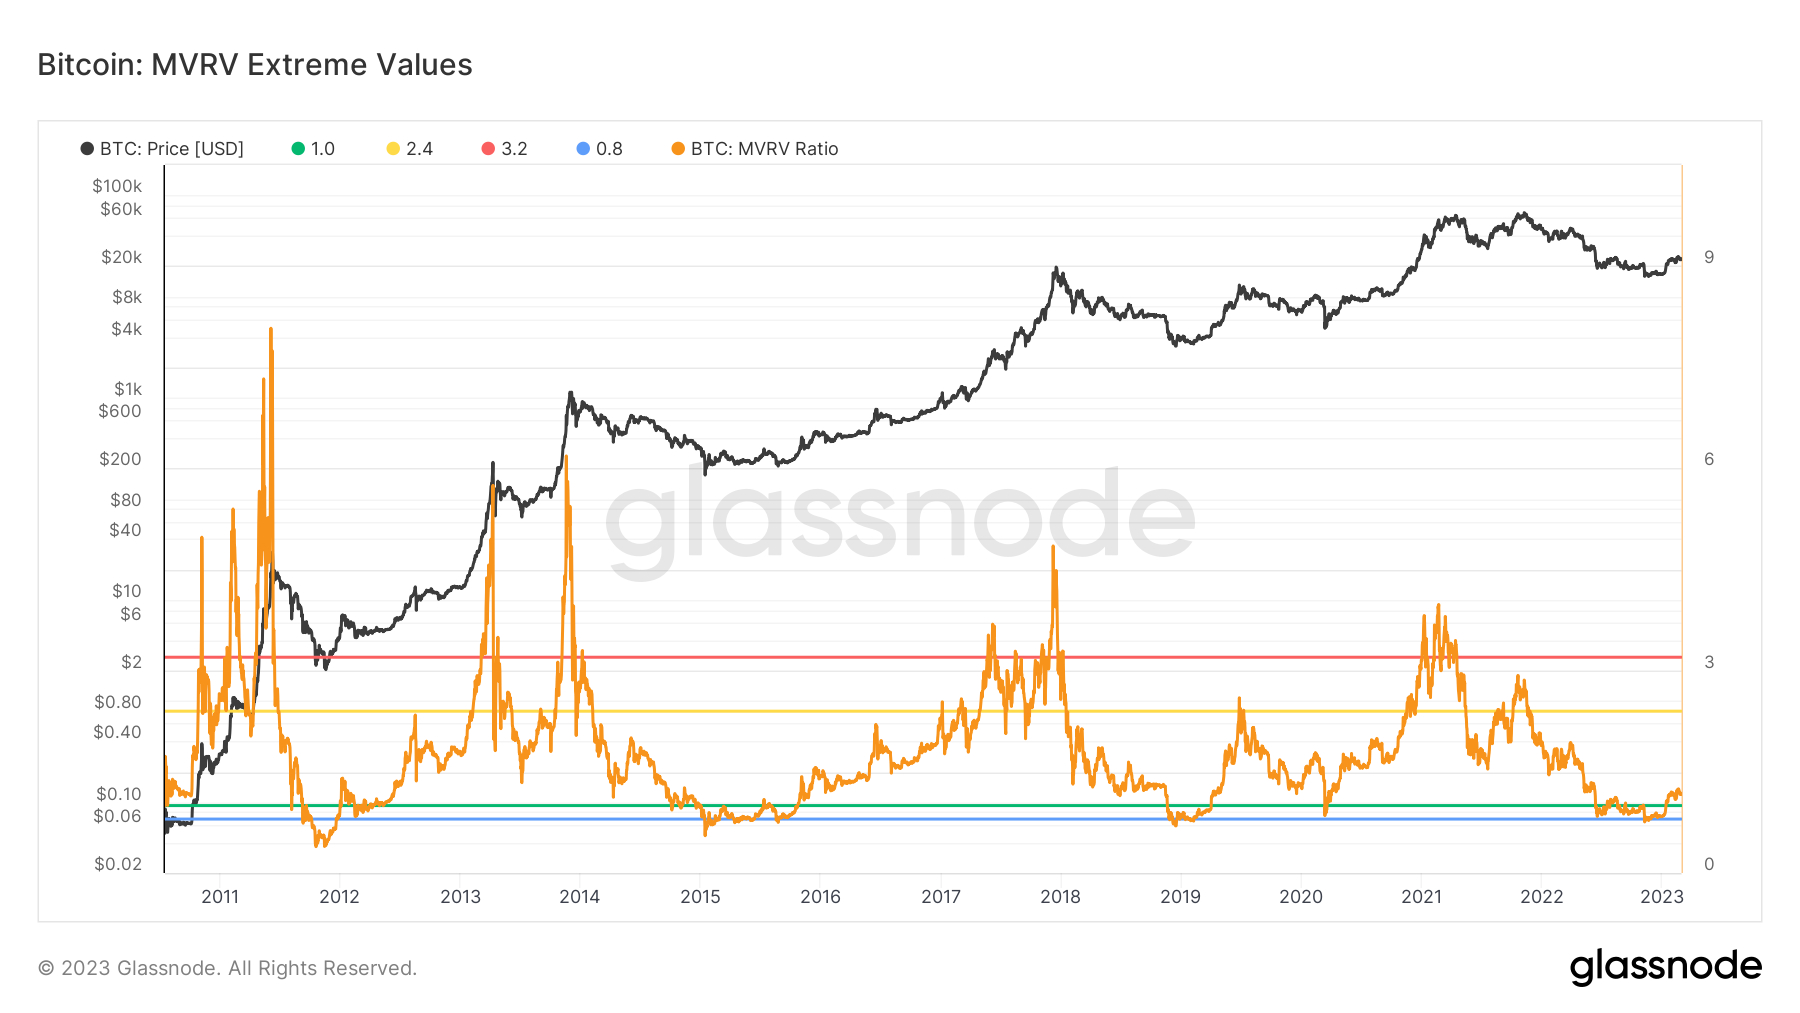
As can be seen in the above graph, the MVRV ratio recently recovered back above 1.0 after falling below the significant 0.8 level in wake of the collapse of FTX last year, a sign of extreme market weakness at the time. Another way to visualize the MVRV ratio is via price bands that can be plotted on the chart alongside Bitcoin’s spot and Realized Price. These essentially show the levels that are 0.8 below and 2.4 and 3.2 times above the Realized Price.
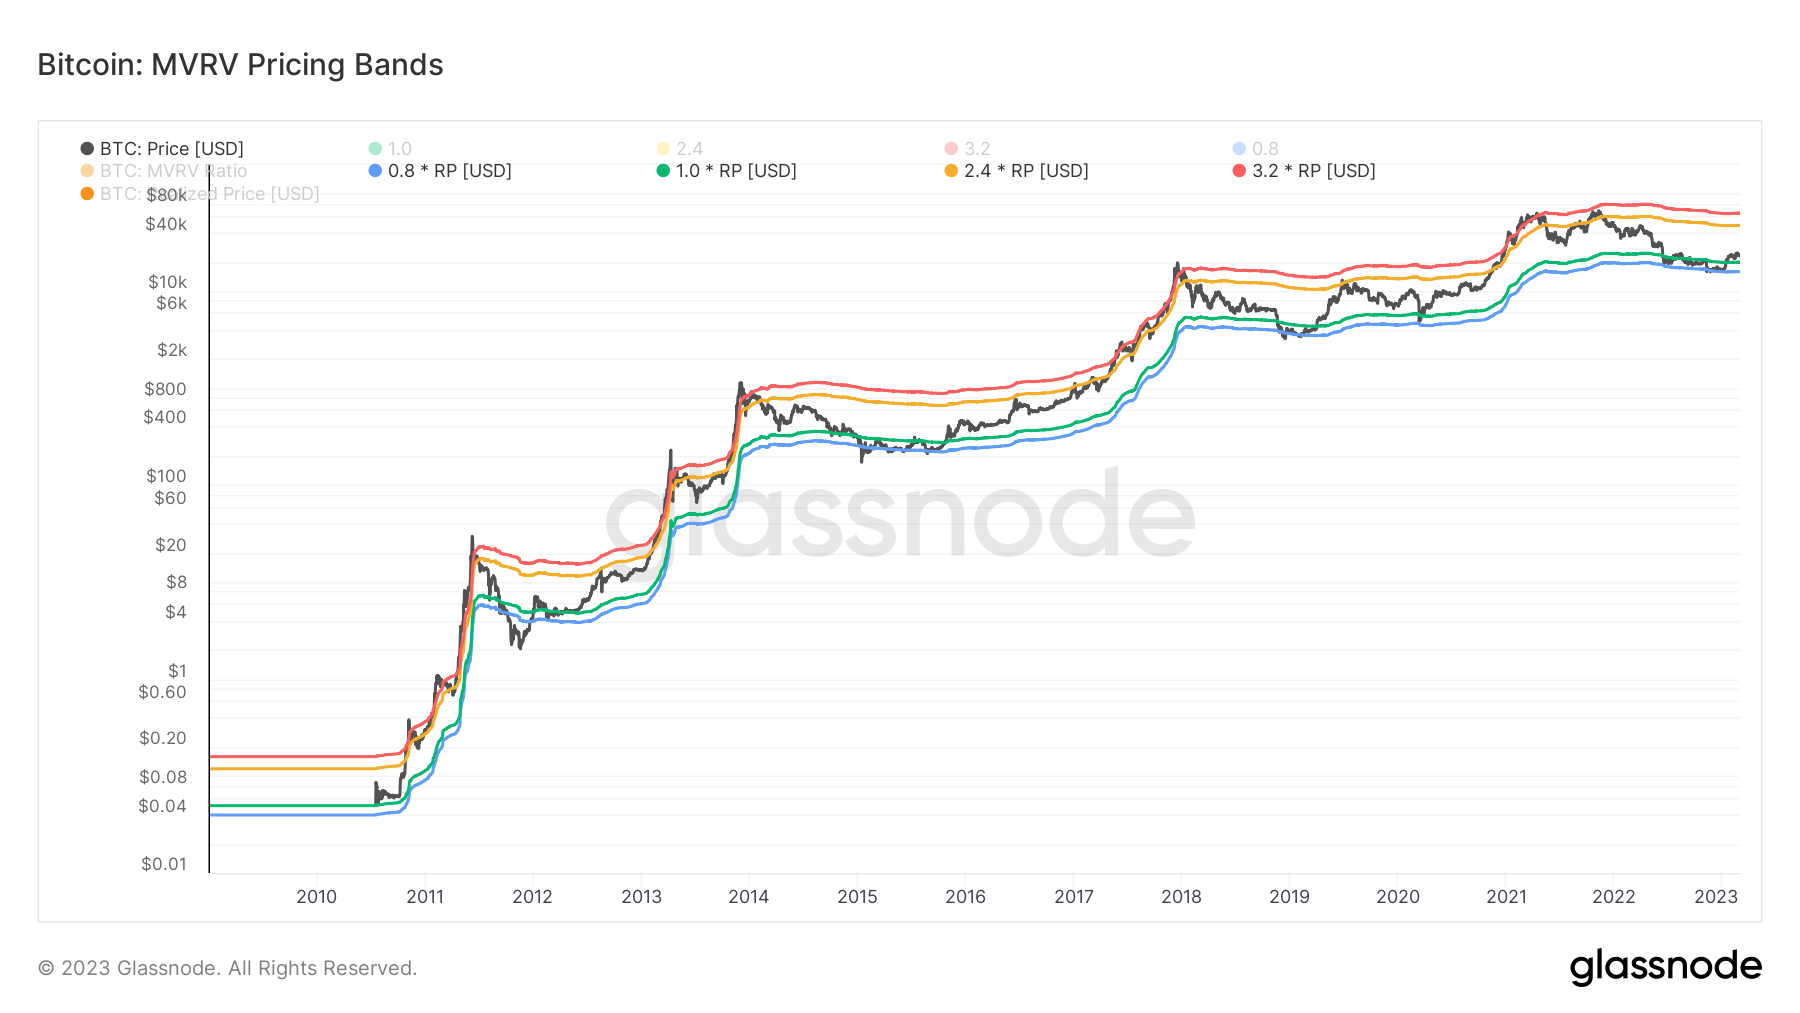
As can be seen in the above chart, when the Bitcoin prices has fallen back to the blue line (meaning the price is 0.8 or less of its Realized Price), this has been a fantastic long-term buying opportunity. Equally, while the Bitcoin price has been able to exceed its Realized Price by 3.2 or more times for short periods of time, sharp pullbacks from the market peak have typically ensued in the medium term.
MVRV Momentum Has Also Turned Positive
The above graphics can be used to identify whether the Bitcoin price relative to its Realized Price has reached extremes. Glassnode also presents MVRV oscillator that can be helpful in determining whether the Bitcoin market is about to head through a prolonged bearish or bullish period.
In the below graphic, Glassnode also plot the 100-Day Simple Moving Average (SMA) of the MVRV Ratio. They note that, historically, the MVRV ratio being above its 100-Day SMA has meant that the Bitcoin price is in a bull market, while when the MVRV has been below its 100-Day SMA, this has typically meant a bear market is occurring.
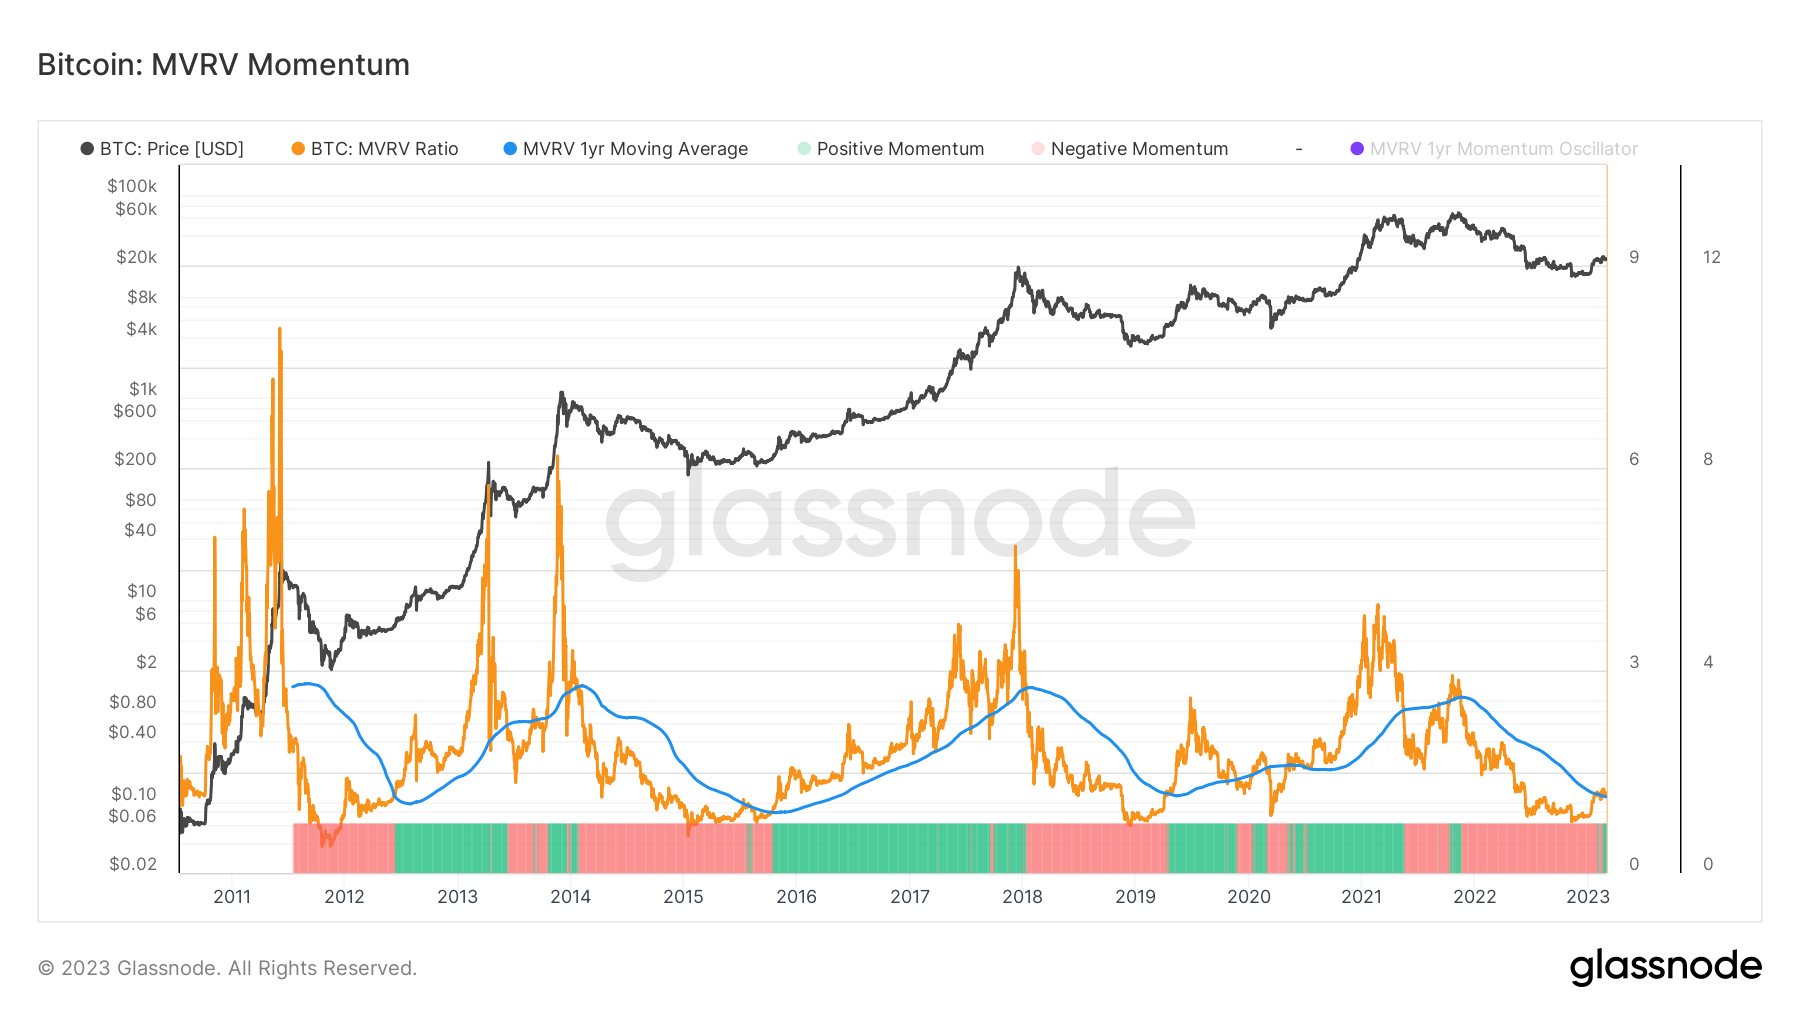
In the graphic below, Glassnode improves on the above oscillator by taking the ratio between the MVRV Ratio, its 100-Day SMA and then subtracting one. Negative scores equal negative momentum in the MVRV Ratio and vice versa. Transitions from a period when MVRV momentum has been negative for some time, like in 2012, 2015 and 2019 and 2020, have all been clear indicators of an incoming and often prolonged Bitcoin bull market.
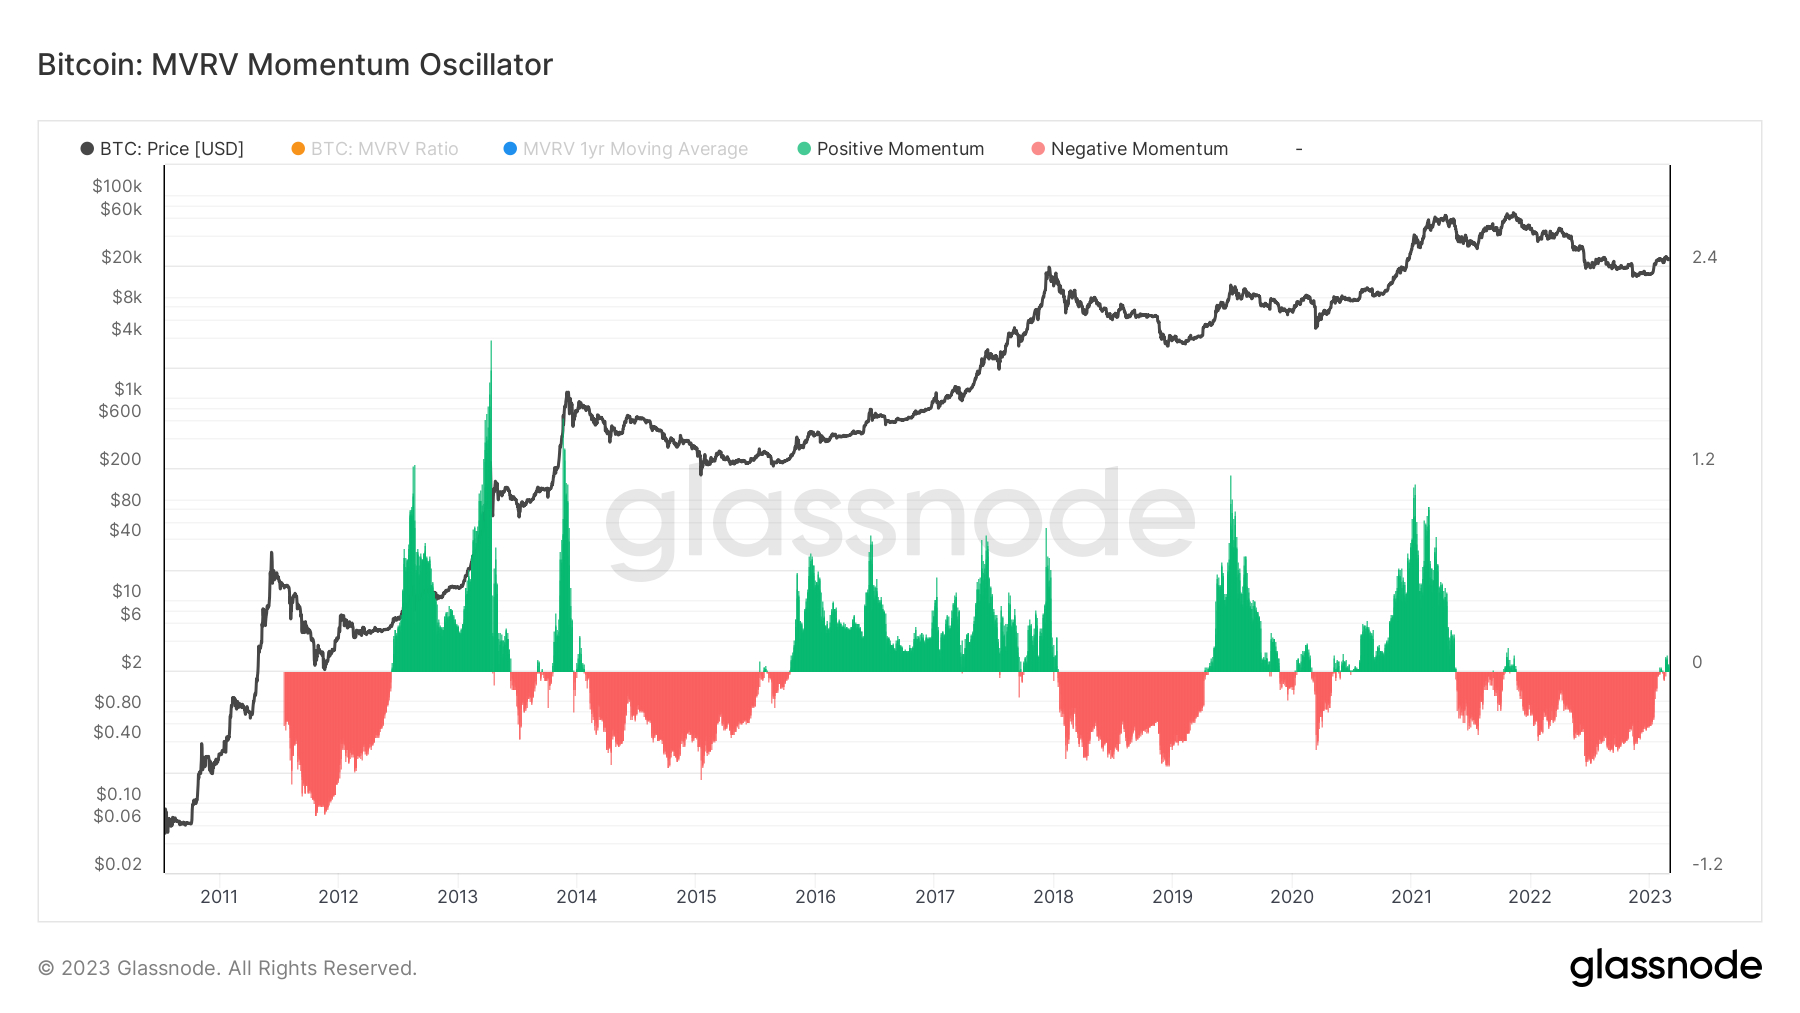
Meanwhile, transitions from a prolonged period of positive MVRV momentum to negative have historically also occurred at the start of prolonged bear markets. As can be seen in the above chart, MVRV Ratio momentum just turned positive (i.e. the ratio moved above its 100-Day SMA). If history is anything to go by, this is a big bullish sign for the Bitcoin price.
Credit: Source link


