


Reason to trust
Strict editorial policy that focuses on accuracy, relevance, and impartiality
Created by industry experts and meticulously reviewed
The highest standards in reporting and publishing
Strict editorial policy that focuses on accuracy, relevance, and impartiality
Morbi pretium leo et nisl aliquam mollis. Quisque arcu lorem, ultricies quis pellentesque nec, ullamcorper eu odio.
Ostium Labs argues that Bitcoin’s uptrend remains intact after August’s reversal, but it draws a bright red line at $98,000. In its September 1 Market Outlook, the firm writes: “Closing below $98k on this timeframe would turn weekly structure bearish,” adding that “above $98k weekly structure is still bullish and therefore we should anticipate the formation of a higher-low.”
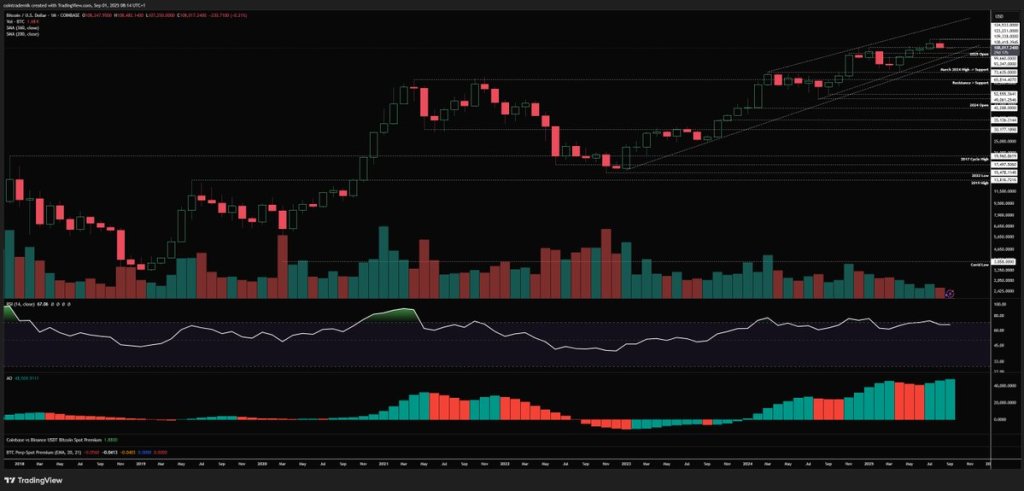
At publication time, Ostium referenced BTC around $108,017, with the August monthly candle settling “firmly red” after wicking through the record to roughly $124.5k and closing near prior resistance-turned-support around $108.2k.
Key Bitcoin Price Levels To Watch Now
On the monthly chart, Ostium sees no evidence of a 2021-style cyclical top. The note acknowledges some momentum divergence on RSI but stresses the absence of confirmation from the Awesome Oscillator: “AO has continued to point towards building momentum throughout the uptrend… I do not think this is even remotely similar to the 2021 top formation.”
Related Reading
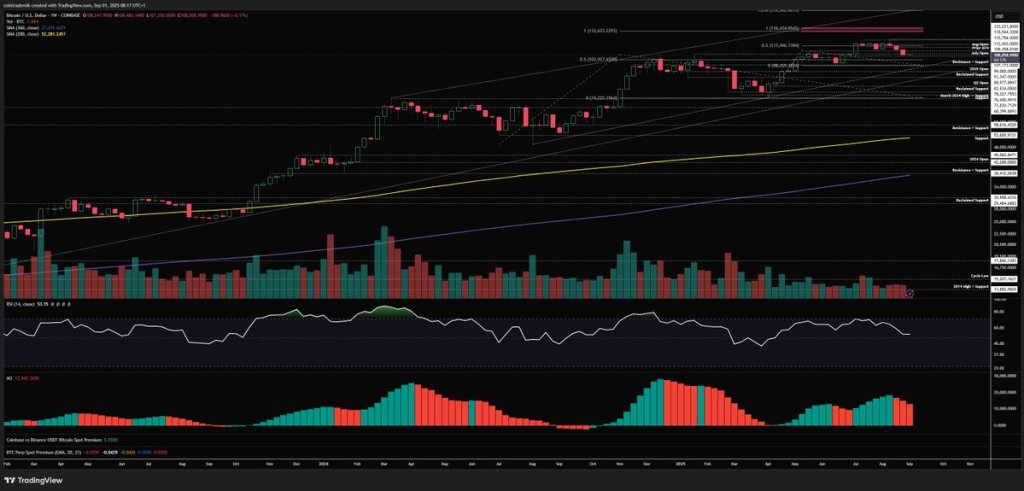
The bear case strengthens only if September “closes below the 2025 open at $93.3k and therefore below local trendline support.” For the bullish path, the team wants September to find support “above the yearly open, but likely much higher around the July lows at $105k,” and “ideally” finish the month green “above the August open at $115k,” a configuration they say would “set us up for expansion beyond the highs in October.”
Weekly structure, by Ostium’s read, “showed no exhaustion on the move higher” and has now reset toward 50 on RSI, a profile the firm says supports trend continuation. Should the market carve a higher low early in September and reclaim momentum, a weekly close “back above $112k leads to a retest of the August open and potentially $117.5k into FOMC with a retest of the highs before month-end.”
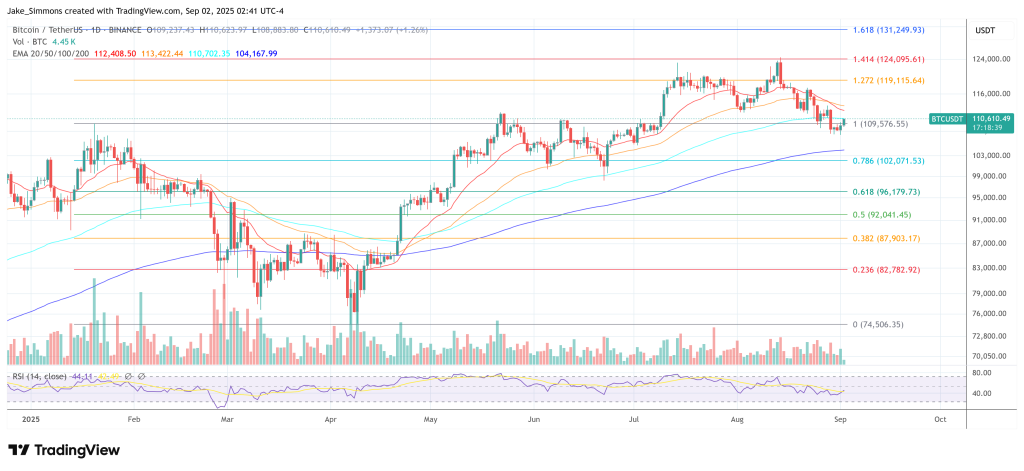
The daily timeframe remains the near-term hurdle. Ostium characterizes the pullback as “orderly,” with supports flipped to resistance on the way down and “the key level… obviously the $112k prior all-time high,” which served as support in early August and then “reclaimed resistance” on last week’s leg lower.
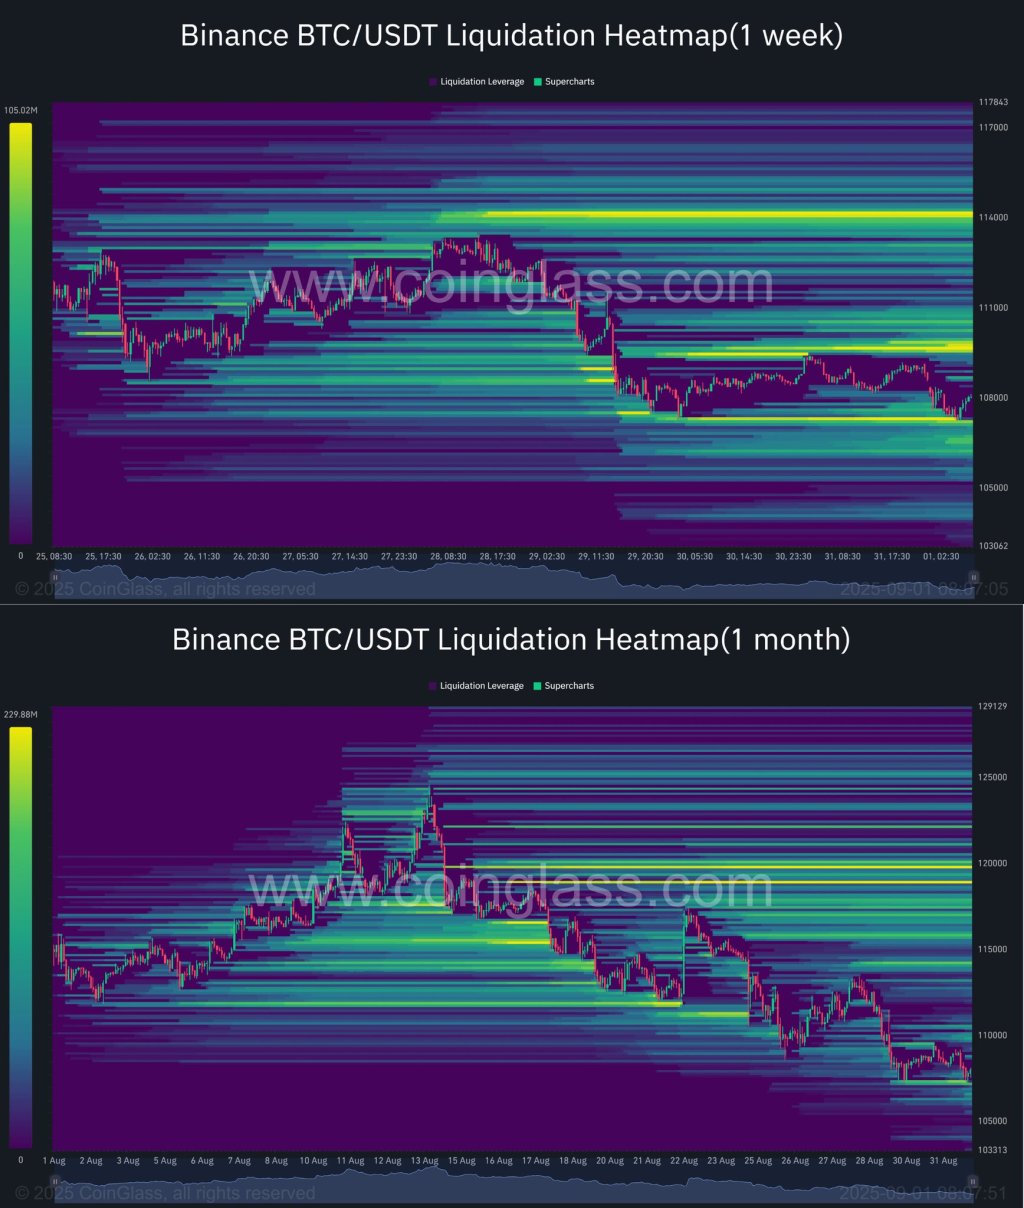
“A breakout and close above the trendline and back above $112k would look like the bottom is in,” they write. A failed probe—“wick above the trendline into $112k and reject”—would bias price toward “the June open at $104.5k, with the 200dMA below that at $101.3k being key demand.” In derivatives, CoinGlass liquidation heatmaps for Binance’s BTC/USDT pair over one week and one month show dense liquidation bands layered above the $114k cap and clustered below around the $120k region, while no significant levels are visible to the downside.
With a macro-heavy week ahead— ISM prints, JOLTS, the Fed’s Beige Book, jobless claims, ADP, ISM Services, and Friday’s Nonfarm Payrolls—Ostium lays out conditional tactical setups. For longs, they prefer evidence of exhaustion into support: trendline resistance respected, “today’s low” taken out via a liquidation wick into the June-open/200-day cluster, and bullish divergence forming there before bidding for a move back to the weekly open and the $112k retest. For shorts, they prefer a sharp early-week squeeze into $112k “with trend exhaustion… having not taken out today’s low around $107k,” fading the pop back into weekly lows with risk reduced if it unfolds ahead of NFP.
Related Reading
Ostium also surveys positioning, pointing to snapshots across Velo and CoinGlass, three-month annualized basis, and the mix between Bitcoin and altcoin open interest, as well as one-week and one-month liquidation maps. While it refrains from headline claims on those dashboards, the note’s technical levels line up with the most concentrated liquidation density visible in the attached heatmaps, where stacked interest remains perched near the $112k pivot overhead and layered through the $105k–$101k demand shelf.
DXY As Tailwind For The BTC Price
The report extends beyond Bitcoin. The dollar backdrop, in Ostium’s framework, remains a tailwind for BTC into year-end. With DXY around 97.2, the firm says the current sequence rhymes with past cyclical drawdowns and expects “DXY to break below 96 and push towards at least 94.6, but more likely 93,” where a bottoming formation could emerge above the 200-month moving average. The secular DXY bull case is not dismissed; rather, Ostium situates the present leg as the final cyclical downswing before a higher-low and multi-year recovery, contingent on policy outcomes. A decisive monthly reclaim of 100 would invalidate the near-term bearish DXY view.
Across assets, the through-line of Ostium’s September map is clarity on thresholds. For Bitcoin, a weekly loss of $98,000 would be the first structural break of the cycle; a daily reclaim of $112,000 would strongly argue the local low is in; and a monthly hold above $105,000 with a close back over $115,000 would tee up fresh highs into October.
At press time, BTC traded at $110,610.
Featured image created with DALL.E, chart from TradingView.com
Credit: Source link


