Solana plummeted substantially over the last 24 hours and was inching towards its crucial support line. The technical outlook of the coin continued to reflect bearishness. Few days ago though, the coin had attempted to bring the bulls back.
At the current moment, SOL was back to trading near the August 2021 level. Buyers also left the market as the bulls were defeated. Price of the coin has now found support on the $38 price mark. With the bears exerting pressure and causing sellers to dominate the market, Solana might again fail to sustain above the $38 price mark.
Major resistance for the coin continues to await at $44 and if SOL regains the bullish vigour then the coin might witness continued upside over the immediate trading sessions. The global cryptocurrency market cap today was at $1.29 Trillion, with a 2.6% negative change in the last 24 hours.
Solana Price Analysis: One Day Chart
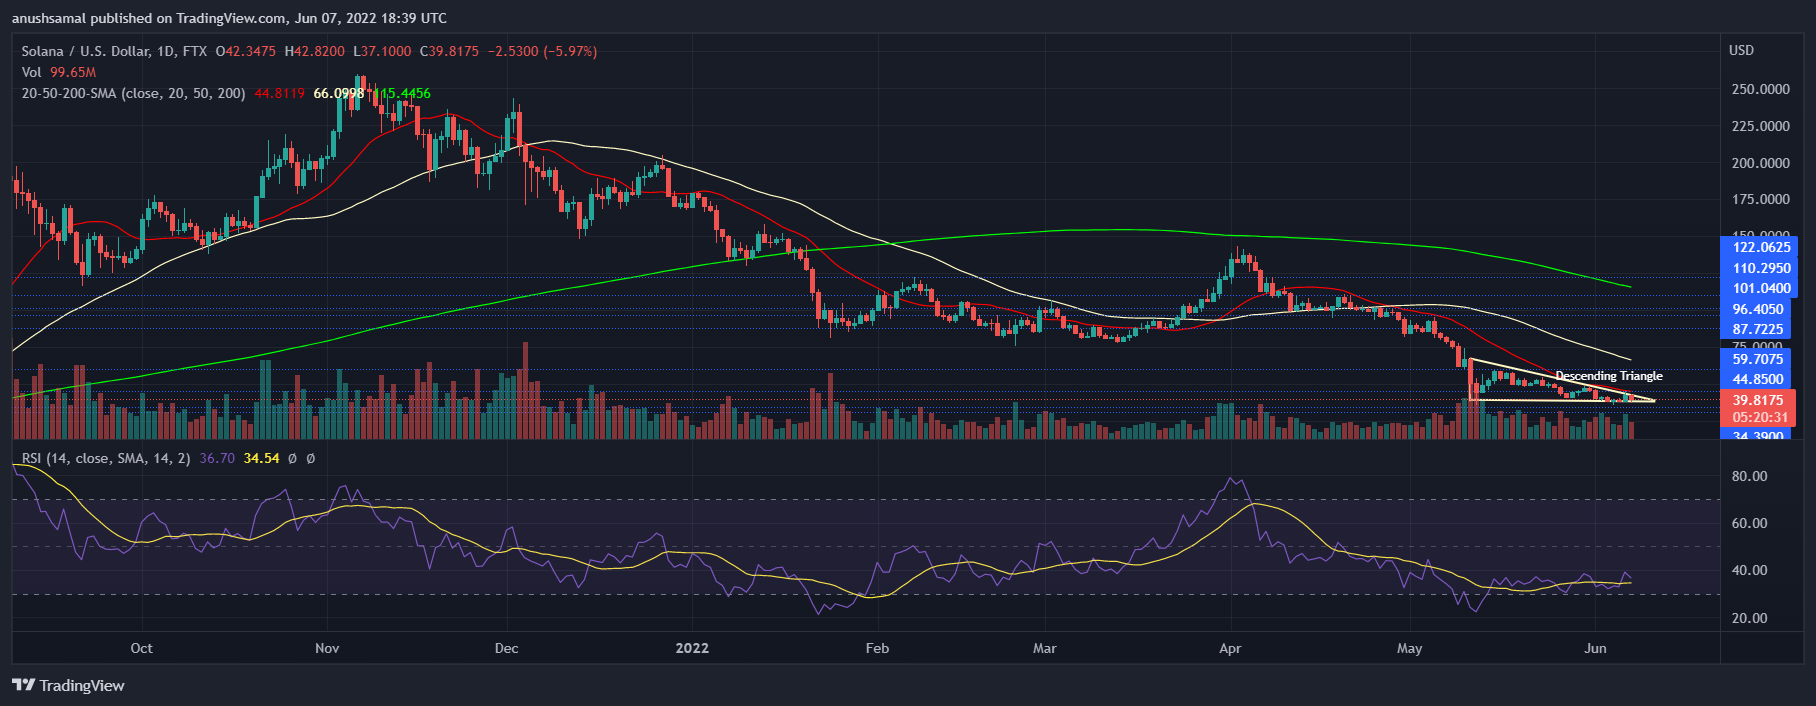
SOL was trading at $39 at press time, it managed to remain above the $38 support level. With the bears that are back, it could be possible that Solana targets falling below the immediate support line. Closest support line after the $38 mark was at $34.
With the coin forming a descending triangle that signifies bearishness, SOL could also aim the $30 price support line. Considering Bitcoin also slightly retraced on the chart, market weakness could be a reason why Solana’s upward movement could be stalled.
Overhead resistance for the coin stood at $44, breaking past which the altcoin may encounter another resistance at $59. The volume of the coin traded in the last session had decreased and was red in colour. This meant bearishness on charts.
Technical Analysis

The altcoin was oversold in the past week, from that scenario, at press time the coin was above the oversold region. Despite being above the oversold region, the coin witnessed heavy selling pressure owing to the recent fall.
The Relative Strength Index noted a downtick signalling a dearth of buyers in the market. The price of SOL was seen below the 20-SMA line which meant that sellers were driving the price momentum in the market.
Continued selling momentum will only strengthen the negative price action, however, a push with continuous demand can send Solana above the 20-SMA line.
Related Reading | Short Position Piling Up, Could This Hint At The Next Bitcoin Move?

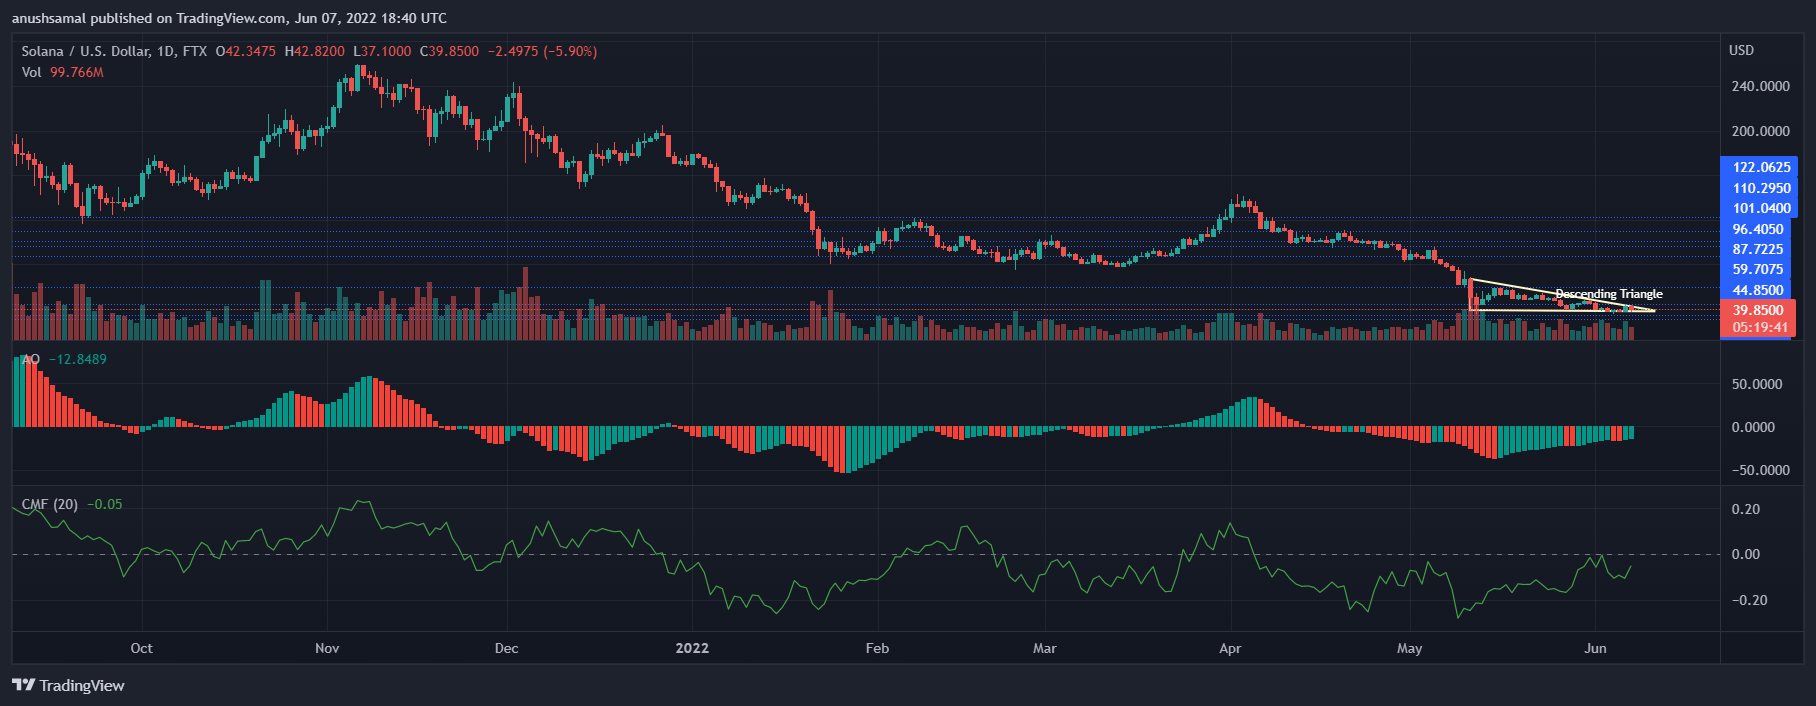
The technicals have painted a mixed signal with the indicators more inclined towards the bears on the chart. The Chaikin Money Flow which indicates the capital outflows and inflows continued to remain below the half-line.
This meant that capital outflows exceeded the inflows despite an uptick on the CMF. Another bullish signal would be the Awesome Oscillator flashing green signal bars.
The indicator is concerned with depicting price momentum and a possible reversal in the same.
The green signal bars were indicative of a buy signal. If buyers follow the signal then bulls could witness some relief on the chart.
Related Reading | Solana Below $40 Amidst Network Outage, Are The Bears Back?
Credit: Source link


