• Live Crypto Prices
  • Crypto News
    • Worldwide
      • Bitcoin
      • Ethereum
      • Altcoin
      • Blockchain
      • Regulation
    • Australian Crypto News
  • Education
    • Cryptocurrency For Beginners
    • Where to Buy Cryptocurrency
    • Where to Store Cryptos
    • Cryptocurrency Tax in Australia 2021
No Result
View All Result
CryptoABC.net
No Result
View All Result

Shiba Inu Hides A 2,000% End-Cycle Breakout, Analyst Predicts

October 27, 2025
in Bitcoin
Reading Time: 3min read
0 0
A A
0
Shiba Inu Hides A 2,000% End-Cycle Breakout, Analyst Predicts
0
SHARES
4
VIEWS
ShareShareShareShareShare

Popular technician Charting Guy (@ChartingGuy) calls Shiba Inu “weak and choppy” and suggests the token may not break out until late in the current crypto cycle. Sharing a weekly Shiba Inu chart, he wrote on Oct. 26, 2025: “SHIB has been weak and choppy all cycle. Won’t do anything until the end imo.”

How High Can Shiba Inu Price Go?

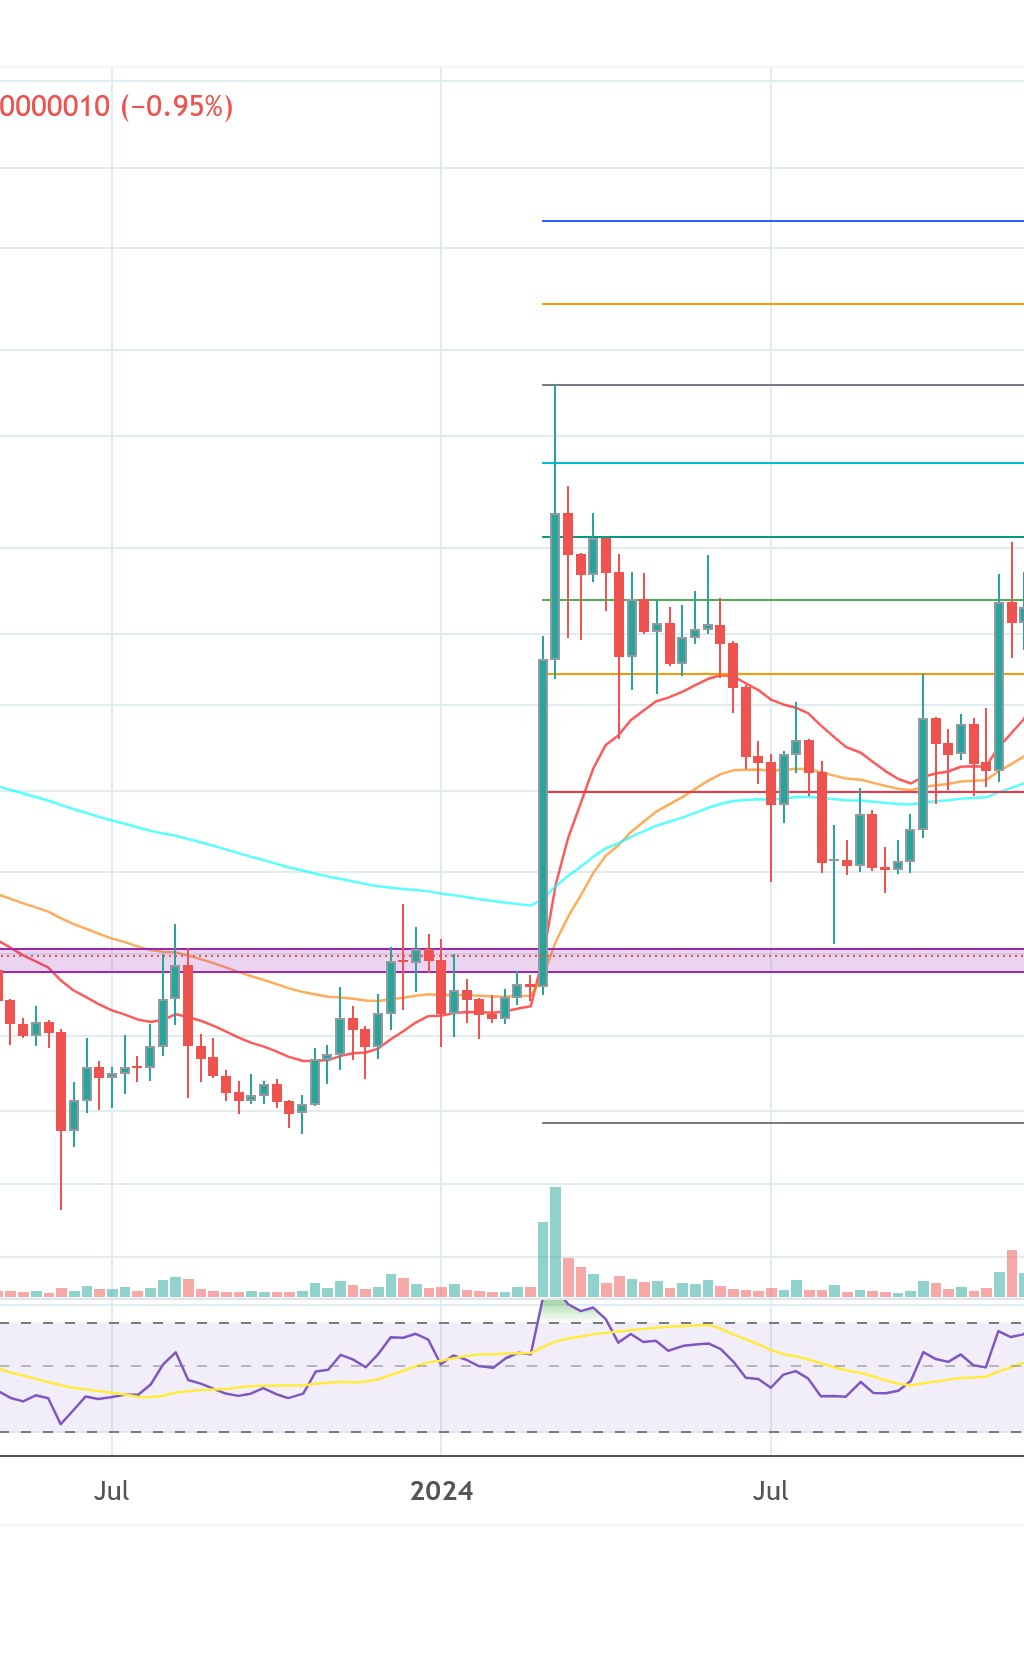
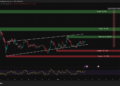
The below TradingView chart is a weekly SHIB/USD study anchored to a Fibonacci ladder. The price marker on the right rail reads $0.000010205, placing SHIB fractionally below the 0.236 retracement band annotated at $0.000011043.

Above that, the chart maps successive overhead levels at 0.382 near $0.000016434, 0.5 around $0.000022661, 0.618 near $0.000031247 and 0.786 at about $0.000049369. The red 1 line flags $0.000088410, with higher extension markers plotted at 1.272 ≈ $0.000185406, 1.414 ≈ $0.000272917 and a terminal 1.618 ≈ $0.000475605.

Shiba Inu price prediction | Source: X @ChartingGuy

A stylized projection trace on the chart depicts a late-cycle, near-vertical advance that only materializes after a prolonged base and then stalls inside the 1.0–1.272 cluster before breaking above the 1.272 Fib extension and topping below the 1.414 Fib extension roughly at $0.000022; the path visually reinforces the author’s contention that SHIB underperforms until the “end.”

Related Reading

In a separate post on Oct. 24, Charting Guy ranked market structures across majors and large-cap altcoins, explicitly placing SHIB in his “Bad Looking Charts” bucket while labeling Bitcoin, Ether, XRP, Solana, BNB and Stellar as “Good Looking Charts.” His list read, in part: “Good Looking Charts: BTC, ETH, XRP, SOL, BNB, XLM … Decent Looking Charts: XDC, DOGE, PENGU, ADA, ONDO, SUI, AAVE, LTC … Eh Looking Charts: PEPE, FLOKI, FLR, LINK, BCH … Bad Looking Charts: SHIB, WIF, ETC, AVAX, FET, RENDER, INJ, CRV, ALGO, SOLO, COREUM, NEAR, VET, COMP, DOT, IOTA, FIL, ATOM, And many more.”

What To Expect

The technical message is unambiguous: on a weekly timeframe, SHIB remains capped beneath early Fibonacci thresholds that many chartists treat as momentum gates. Remaining below 0.236 typically signals that price has yet to reclaim even the shallowest retracement of the prior cycle; clearing it often opens room to test the 0.382–0.5 midpoint zone where trends either accelerate or fail.

Related Reading

In Charting Guy’s map, structurally meaningful inflection areas stack tightly from roughly $0.000016 to $0.000031, with the 0.618 level near $0.000031 attributed the role of a trend-confirmation threshold. The cycle-top roadmap he drew concentrates risk and reward into the higher cluster around $0.000088 to $0.000185, a range often watched by Fibonacci practitioners for exhaustion and distribution in late-stage moves. However, a rise to $0.00022 could still mean an incredible upside for SHIB of around 2,055.81%—a roughly 20.56-fold increase.

Contextually, his relative-strength table is just as important as the levels. By grouping SHIB with other “bad looking” structures while upgrading Bitcoin, Ether, XRP, Solana and BNB, he is signaling an expectation that market breadth will remain narrow and quality-led before any speculative rotation into meme-beta like SHIB. That framework aligns with his succinct call that SHIB “won’t do anything until the end,” implying a sequencing view rather than a categorical dismissal.

At press time, SHIB traded at $0.00001046.

Shiba Inu price
SHIB bounces from the demand zone, 1-week chart | Source: SHIBUSDT on TradingView.com

Featured image created with DALL.E, chart from TradingView.com

Credit: Source link

ShareTweetSendPinShare
Previous Post

US Mint Miner Revolutionizes Crypto Mining with Low-Cost ASIC Hosting

Next Post

Pepe Price Prediction: PEPE Price Dumped 30% in October, But Analyst Points to a Reversal Coming Soon – Is PEPE Going to the Moon This Week?

Next Post
Pepe Price Prediction: PEPE Price Dumped 30% in October, But Analyst Points to a Reversal Coming Soon – Is PEPE Going to the Moon This Week?

Pepe Price Prediction: PEPE Price Dumped 30% in October, But Analyst Points to a Reversal Coming Soon – Is PEPE Going to the Moon This Week?

You might also like

Solana Price Prediction: Buying Pressure Just Doubled — Is SOL About to Explode Past $100?

Solana Price Prediction: Buying Pressure Just Doubled — Is SOL About to Explode Past $100?

March 13, 2026
Bitcoin Wins As Trump Pumps GDP, Suppresses Oil: Arthur Hayes

Bitcoin Is In A Value Zone, But Not Yet At Deep Value: Edwards

March 13, 2026
Understanding the Role and Capabilities of AI Agents

LangChain Gives AI Agents Control Over Their Own Memory Management

March 12, 2026
Bitcoin Short Bets Surge—Will Bears Get Squeezed?

Bitcoin Short Bets Surge—Will Bears Get Squeezed?

March 10, 2026
VeryAI Raises $10M to Build Palm-Scan System for Verifying Humans Online

VeryAI Raises $10M to Build Palm-Scan System for Verifying Humans Online

March 13, 2026
Ethereum Price Prediction: Vitalik Just Revealed the 3 Rules That Could Change ETH Forever

Ethereum Price Prediction: Vitalik Just Revealed the 3 Rules That Could Change ETH Forever

March 13, 2026
CryptoABC.net

This is an Australian online news/education portal that aims to provide the latest crypto news, real-time updates, education and reviews within Australia and around the world. Feel free to get in touch with us!

What's New Here!

DOT Price Prediction: Polkadot Eyes $4.01 Recovery Despite Current Bearish Momentum

DOT Price Prediction: Polkadot Targets $1.72 Breakthrough After 11.56% Daily Surge

March 16, 2026
Why Is Crypto Up: BTC USD Decoupling From Gold Amid Heated Israel-Iran War

Why Is Crypto Up: BTC USD Decoupling From Gold Amid Heated Israel-Iran War

March 16, 2026

Subscribe Now

  • Contact Us
  • Privacy Policy
  • Terms of Use
  • DMCA

© 2021 cryptoabc.net - All rights reserved!

No Result
View All Result
  • Live Crypto Prices
  • Crypto News
    • Worldwide
      • Bitcoin
      • Ethereum
      • Altcoin
      • Blockchain
      • Regulation
    • Australian Crypto News
  • Education
    • Cryptocurrency For Beginners
    • Where to Buy Cryptocurrency
    • Where to Store Cryptos
    • Cryptocurrency Tax in Australia 2021

© 2021 cryptoabc.net - All rights reserved!

Welcome Back!

Login to your account below

Forgotten Password?

Create New Account!

Fill the forms below to register

All fields are required. Log In

Retrieve your password

Please enter your username or email address to reset your password.

Log In
Please enter CoinGecko Free Api Key to get this plugin works.