


Caroline Bishop
Jul 29, 2025 06:18
Shiba Inu trades lower at current levels after 30% July surge driven by AI integration initiatives, with technical indicators showing mixed signals for SHIB traders.
Quick Take
• SHIB currently trading with -6.01% decline in 24-hour session
• Shiba Inu’s RSI at 48.53 indicates neutral momentum despite recent pullback
• AI integration under ‘Jul-AI’ initiative continues driving long-term bullish sentiment
What’s Driving Shiba Inu Price Today?
The SHIB price experienced a notable pullback in the latest trading session, declining 6.01% despite the broader positive momentum that characterized July 2025. This retreat comes after Shiba Inu delivered an impressive 30% surge throughout July, primarily fueled by the announcement of AI-focused advancements under the ‘Jul-AI’ initiative.
The most recent catalyst emerged on July 28th when Shiba Inu’s development team unveiled significant AI integration plans, which initially sparked increased whale accumulation and bullish technical setups. However, the current price action suggests profit-taking behavior following the substantial July rally, with traders likely securing gains after the month-long uptrend.
Earlier developments this week included reports of SHIB breaking free from a year-long downtrend pattern on July 26th, which technical analysts interpreted as a potential signal for sustained upward momentum. The increased token burn rate accompanying these AI initiatives had created additional bullish sentiment among SHIB holders, though today’s decline indicates short-term consolidation may be underway.
Despite the 33% annual decline that preceded this July rally, market analysts had predicted a 40% recovery potential, with some setting ambitious price targets of $0.000017 for the SHIB/USDT trading pair.
SHIB Technical Analysis: Mixed Signals Emerge
The current Shiba Inu technical analysis reveals a complex picture with competing signals across different timeframes. SHIB’s RSI reading of 48.53 positions the token in neutral territory, suggesting neither overbought nor oversold conditions despite the recent 6% decline.
The SHIB MACD histogram shows bearish momentum with a negative reading, indicating that selling pressure may be building in the short term. This bearish MACD signal contrasts with the broader bullish narrative that drove July’s 30% rally, suggesting traders should exercise caution in the immediate term.
Shiba Inu’s Stochastic indicators paint an even more cautious picture, with the %K at 16.33 and %D at 26.36, both residing in oversold territory. This positioning could indicate that SHIB price may be approaching a potential bounce level, though confirmation would require additional bullish signals.
The Bollinger Bands analysis shows SHIB’s %B position at 0.2987, indicating the price is trading in the lower portion of the recent range. This positioning often precedes either a continuation of the downward move or a reversal back toward the middle band, depending on broader market sentiment and volume confirmation.
Shiba Inu Price Levels: Key Support and Resistance
Based on current technical analysis, Shiba Inu support levels and resistance zones are critical for determining the next directional move. The immediate support zone represents a crucial test for SHIB bulls who drove the July rally.
Should SHIB resistance at the immediate level hold, traders might expect continued consolidation within the current range. However, a break above this SHIB resistance could signal resumption of the bullish trend that characterized much of July 2025.
The strong support level below current prices serves as a critical line in the sand for SHIB holders. A decisive break below this Shiba Inu support level could indicate that the July rally has concluded and deeper retracement may follow.
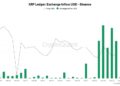
Volume analysis from Binance spot market data shows $27.2 million in 24-hour SHIB trading activity, which remains relatively robust despite the price decline. This volume level suggests continued interest in the SHIB/USDT pair, though significantly below the peaks seen during July’s rally phase.
Should You Buy SHIB Now? Risk-Reward Analysis
For aggressive traders, the current SHIB price pullback may present a strategic entry opportunity, particularly given the oversold Stochastic readings and the fundamental support from ongoing AI integration initiatives. However, the bearish MACD momentum suggests waiting for additional confirmation before establishing new long positions.
Conservative investors might prefer to wait for clearer technical signals, specifically looking for SHIB’s RSI to move above 50 and the MACD to show positive momentum before considering entry. The neutral RSI reading provides flexibility for both scenarios.
Swing traders should focus on the immediate resistance and support levels, with clear stop-loss orders below the strong support zone. Based on Binance spot market data, risk management becomes crucial given the recent volatility patterns in SHIB price action.
Day traders might find opportunities in the current range-bound movement, though the mixed technical signals require careful position sizing and tight risk controls. The 24-hour trading range provides clear boundaries for short-term trading strategies.
Conclusion
SHIB price faces a critical juncture as it consolidates gains from July’s impressive 30% rally. While the AI integration initiatives continue providing fundamental support, immediate technical indicators suggest caution for the next 24-48 hours. Traders should monitor the key support and resistance levels closely, with particular attention to volume confirmation and RSI movement above neutral territory for bullish continuation signals.
Image source: Shutterstock
Credit: Source link


