• Live Crypto Prices
  • Crypto News
    • Worldwide
      • Bitcoin
      • Ethereum
      • Altcoin
      • Blockchain
      • Regulation
    • Australian Crypto News
  • Education
    • Cryptocurrency For Beginners
    • Where to Buy Cryptocurrency
    • Where to Store Cryptos
    • Cryptocurrency Tax in Australia 2021
No Result
View All Result
CryptoABC.net
No Result
View All Result

Quant Explains Why Bitcoin Bull Cycle Is Only In Phase 1

August 31, 2021
in Bitcoin
Reading Time: 4min read
0 0
A A
0
Quant Explains Why Bitcoin Bull Cycle Is Only In Phase 1
0
SHARES
9
VIEWS
ShareShareShareShareShare

Top Quant uses the puell multiple to point out a pattern that explains why the current Bitcoin bull cycle is only in the first phase.

The Bull Market Is Not Over, Phase 1 Has Just Begun

According to a CryptoQuant analyst, past cycles show that the current Bitcoin bull market isn’t over yet. The puell multiple seems to reveal where the price might head next.

The puell multiple is a BTC indicator used to tell how healthy miners’ revenue is. It’s calculated by dividing the mining revenue by the 365-day moving average (MA) of the same.

Puell Multiple= Mining Revenue USD ÷ 365 MA​ (Mining Revenue USD​)​

With the help of the metric, it becomes possible to say how much selling pressure miners are facing. When the indicator has high values, miner revenue is relatively healthy, thus miners aren’t compelled to sell. While low values could suggest they are facing considerable selling pressure.

Since miners hold large amounts of Bitcoin, significant selling pressure among them could impact the price of the cryptocurrency on a visible scale.

Now, here is how the puell multiple changed during the 2011 and 2013 bull cycles:

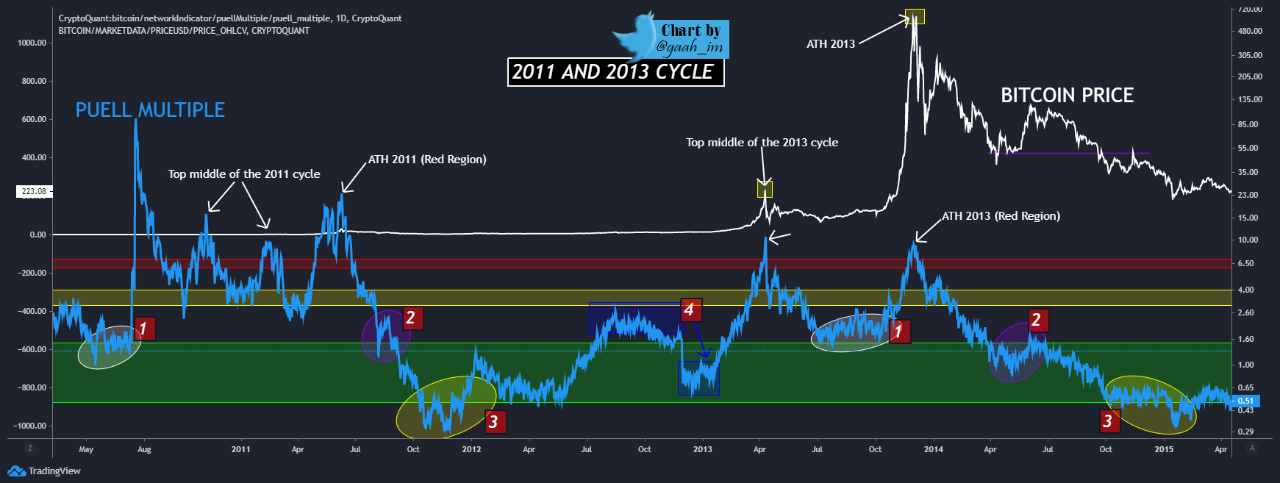
The Puell Multiple vs the Bitcoin price during 2011 and 2013

The above graph numbers the different phases of these runs, and the colored zones help reveal the pattern of where the price heads next after touching each.

Related Reading | Why Bitcoin Dominance Could Submit To Altcoin Season Several Months Longer

During a mid-cycle top, the price touches the yellow box. An end-of-cycle top is signaled when the value touches the red zone.

A new cycle doesn’t start until after a mid-cycle top post halving is reached. The below chart shows how the 2017 bull run looked like as well as how the current one may end up looking like:

Bitcoin 2017, 2021

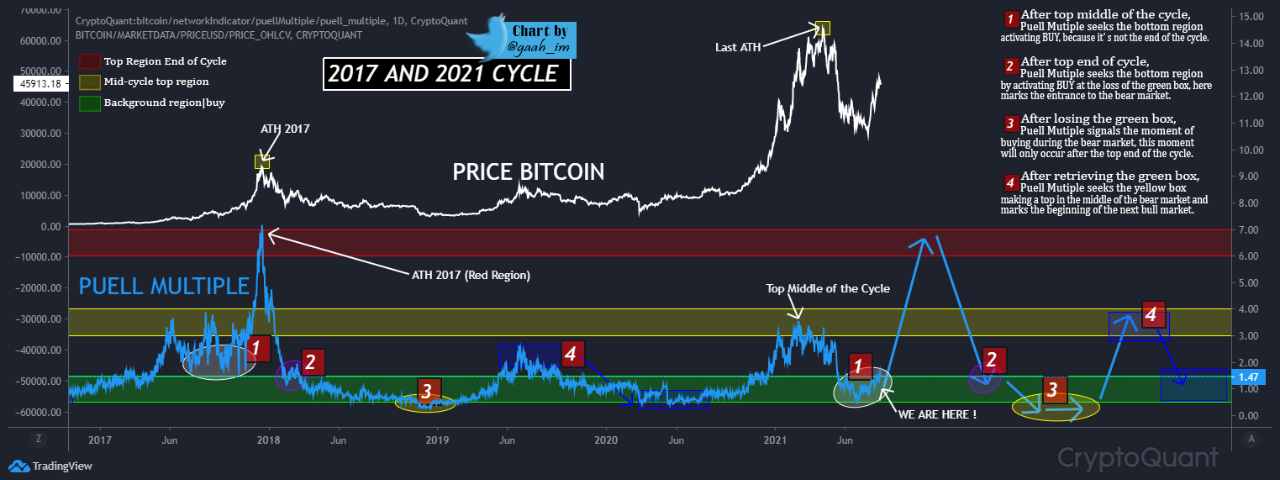
The current Bitcoin bull run has just begun

Examining this graph makes it clear that the 2017 cycle also followed a similar pattern for the price vs puell multiple chart.

Related Reading | Bitcoin Mempool Shows Low Demand?, Why Bears Could Stage A Comeback

Now, based on this pattern, it looks like the current bull run may only be in the first phase. If a similar trend continues to be followed, BTC should make a large move up next as the coin hits a new ATH.

Bitcoin Price

At the time of writing, BTC’s price floats around $47.8k, down 1.5% in the last 7 days. Over the past month, the coin has accumulated 15% in gains.

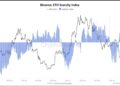
Here is a chart for the trend in Bitcoin’s value over the past three months:

Bitcoin Price Chart

BTC continues on an overall downtrend | Source: BTCUSD on TradingView
Featured image from Unsplash.com, charts from CryptoQuant, TradingView.com

Credit: Source link

ShareTweetSendPinShare
Previous Post

European Commission Exploring Asset Register Option That May Include Crypto

Next Post

DeFi Platform Cream Finance Loses $26,000,000 in Hack

Next Post
DeFi Platform Cream Finance Loses $26,000,000 in Hack

DeFi Platform Cream Finance Loses $26,000,000 in Hack

You might also like

Arthur Hayes Deploys Net Liquidity Strategy: Not Buying BTC Now Even If He Has Only $1

Arthur Hayes Deploys Net Liquidity Strategy: Not Buying BTC Now Even If He Has Only $1

March 11, 2026
Why Bitcoin Can’t Be Explained By A Single Economic Cycle

Analyst Says Bitcoin Price Bottom Hasn’t Happened Yet, Gives Timeline To Expect Reversal

March 5, 2026
Crypto Exchange Predicts When Shiba Inu Price Will Reach $0.01

Analyst Shares The Best Time To Buy Shiba Inu, And The Best Time To Sell

March 6, 2026
Bitcoin ETFs Break 5-Month Streak With 2nd Consecutive Week Of Inflows

Bitcoin ETFs Break 5-Month Streak With 2nd Consecutive Week Of Inflows

March 8, 2026
Bitcoin’s Stock Correlation Doesn’t Undermine Its Diversification Role

Bitcoin’s Stock Correlation Doesn’t Undermine Its Diversification Role

March 9, 2026
XRP Price Prediction: XRP Ledger Explodes Past 2.7 Million Transactions – Can Institutions Send XRP to $100?

XRP Price Prediction: XRP Ledger Explodes Past 2.7 Million Transactions – Can Institutions Send XRP to $100?

March 11, 2026
CryptoABC.net

This is an Australian online news/education portal that aims to provide the latest crypto news, real-time updates, education and reviews within Australia and around the world. Feel free to get in touch with us!

What's New Here!

XRP Bollinger Bands Are Squeezing—Volatility Incoming?

XRP Bollinger Bands Are Squeezing—Volatility Incoming?

March 12, 2026
Ethereum Scarcity Index Turns Positive as ETH USD Pushed Back Above $2,000

Ethereum Scarcity Index Turns Positive as ETH USD Pushed Back Above $2,000

March 12, 2026

Subscribe Now

  • Contact Us
  • Privacy Policy
  • Terms of Use
  • DMCA

© 2021 cryptoabc.net - All rights reserved!

No Result
View All Result
  • Live Crypto Prices
  • Crypto News
    • Worldwide
      • Bitcoin
      • Ethereum
      • Altcoin
      • Blockchain
      • Regulation
    • Australian Crypto News
  • Education
    • Cryptocurrency For Beginners
    • Where to Buy Cryptocurrency
    • Where to Store Cryptos
    • Cryptocurrency Tax in Australia 2021

© 2021 cryptoabc.net - All rights reserved!

Welcome Back!

Login to your account below

Forgotten Password?

Create New Account!

Fill the forms below to register

All fields are required. Log In

Retrieve your password

Please enter your username or email address to reset your password.

Log In
Please enter CoinGecko Free Api Key to get this plugin works.