• Live Crypto Prices
  • Crypto News
    • Worldwide
      • Bitcoin
      • Ethereum
      • Altcoin
      • Blockchain
      • Regulation
    • Australian Crypto News
  • Education
    • Cryptocurrency For Beginners
    • Where to Buy Cryptocurrency
    • Where to Store Cryptos
    • Cryptocurrency Tax in Australia 2021
No Result
View All Result
CryptoABC.net
No Result
View All Result

Quant Explains How Gemini Netflow Can Predict Bitcoin Tops

September 14, 2021
in Bitcoin
Reading Time: 3min read
0 0
A A
0
Quant Explains How Gemini Netflow Can Predict Bitcoin Tops
0
SHARES
10
VIEWS
ShareShareShareShareShare

Quant explains how there may be a correlation between the Gemini Bitcoin netflow and BTC price tops, based on pattern of the last few years.

Can Gemini Netflow Predict Bitcoin’s Price Tops?

As posted by an analyst on CryptoQuant, the historical chart for the Gemini netflow (30-day MA) vs the price reveals there could be a correlation between the indicator and BTC tops.

The Bitcoin netflow here refers to the net number of coins exiting or entering the crypto exchange Gemini. The indicator’s value is simply calculated by taking the difference between the inflows and the outflows.

When the netflow takes negative values, it means more BTC is moving out of the exchange than in. During such periods, investors are withdrawing their coins to personal wallets, either for hodling or for selling through OTC deals.

Similarly, positive values imply that investors are moving their Bitcoin to exchanges for altcoin purchasing or withdrawing to fiat.

The below chart shows the trend for the Gemini BTC netflow over the past few years after applying a 30-day moving average (MA):

The correlation between the BTC price and the Gemini netflow | Source: CryptoQuant

The above chart highlights certain time periods in the history of Bitcoin versus the trend of the indicator then. Here is a breakdown:

The first period is 2017. The indicator showed a local top and started declining 5 days before the then price ATH was achieved.

Related Reading | Forget Walmart, Here’s The Real Reason Why Bitcoin Crashed

Next is 2019, where a similar trend seems to have been followed. Here, the BTC price peak wasn’t made until 23 days after the Gemini netflow started declining.

Then there is 2020, which had two instances where the pattern followed. And finally, the indicator was also able to correctly predict the 2021 ATH as well as the top of the latest rally.

Related Reading | Bitcoin Exchange Reserves Lowest In 3 Years, What Does It Mean For The Price?

The chart reveals all these peaks were attained after an average of 20 days from the netflow local top, with the latest high taking the longest (26 days).

Going by these cases, there does seem to be a correlation between the Gemini netflow declining after forming a peak and the Bitcoin price top.

BTC Price

At the time of writing, Bitcoin’s price floats around $46.7k, down 0.1% in the last 7 days. Over the past month, the indicator has gained 1.3% in value.

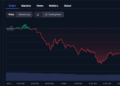
Here is a chart showing the trend in the price of the coin over the last three months:

Bitcoin Price Chart

BTC's price shows high volatility | Source: BTCUSD on TradingView

Over the last few days, Bitcoin’s value has shown a lot of volatility, and at the moment, it seems to be going back up. Some indicators suggest that BTC’s next move up could very well be the last for this run.

Credit: Source link

ShareTweetSendPinShare
Previous Post

Crypto Roundup: September 13th, 2021

Next Post

U.S. House Democrats Want To Close Tax Loophole for Crypto Investors

Next Post
U.S. House Democrats Want To Close Tax Loophole for Crypto Investors

U.S. House Democrats Want To Close Tax Loophole for Crypto Investors

You might also like

WAR Token Explodes 100%, Then Crashes 20% In Sudden Sell-Off

WAR Token Explodes 100%, Then Crashes 20% In Sudden Sell-Off

March 9, 2026
BitMine Buys Record 60,976 ETH for $120M as Tom Lee Calls Crypto Winter Bottom

BitMine Buys Record 60,976 ETH for $120M as Tom Lee Calls Crypto Winter Bottom

March 10, 2026
Bitcoin At The Bottom? The 23-Month Cycle That Has Never Failed

Bitcoin At The Bottom? The 23-Month Cycle That Has Never Failed

March 9, 2026
Bitcoin May Sink To $50K, Standard Chartered’s Kendrick Warns

Bitcoin May Sink To $50K, Standard Chartered’s Kendrick Warns

March 11, 2026
Bitcoin Vault Security Advances With Babylon-Ledger Integration

Bitcoin Vault Security Advances With Babylon-Ledger Integration

March 11, 2026
Zcash Spinout ZODL Raises $25M After Electric Coin Company Exodus

Zcash Spinout ZODL Raises $25M After Electric Coin Company Exodus

March 10, 2026
CryptoABC.net

This is an Australian online news/education portal that aims to provide the latest crypto news, real-time updates, education and reviews within Australia and around the world. Feel free to get in touch with us!

What's New Here!

Hyperliquid (HYPE) Could See Prices Reach $190 In Optimistic Market Capture Scenario

Hyperliquid (HYPE) Could See Prices Reach $190 In Optimistic Market Capture Scenario

March 14, 2026
Billionaire Says Stablecoins Could Power Global Payments in 10–15 Years

Billionaire Says Stablecoins Could Power Global Payments in 10–15 Years

March 14, 2026

Subscribe Now

  • Contact Us
  • Privacy Policy
  • Terms of Use
  • DMCA

© 2021 cryptoabc.net - All rights reserved!

No Result
View All Result
  • Live Crypto Prices
  • Crypto News
    • Worldwide
      • Bitcoin
      • Ethereum
      • Altcoin
      • Blockchain
      • Regulation
    • Australian Crypto News
  • Education
    • Cryptocurrency For Beginners
    • Where to Buy Cryptocurrency
    • Where to Store Cryptos
    • Cryptocurrency Tax in Australia 2021

© 2021 cryptoabc.net - All rights reserved!

Welcome Back!

Login to your account below

Forgotten Password?

Create New Account!

Fill the forms below to register

All fields are required. Log In

Retrieve your password

Please enter your username or email address to reset your password.

Log In
Please enter CoinGecko Free Api Key to get this plugin works.