


The Bitcoin June candle close is ugly, and clearly shows indecision in the market. Is the bull market structure broken, or are new highs still likely this year? No one knows, and price action has reached a stalemate.
However, the Ichimoku indicator could not only provide information on what happens if support holds or fails across crypto, it could also provide clues as to when Bitcoin tops and even finds its next bear market bottom.
All About The Ichimoku Kinkō Hyō Technical Analysis Indicator
The Ichimoku Kinkō Hyō is a popular technical analysis tool designed by Japanese journalist Goichi Hosoda in the late 1930s. Hosoda was nicknamed Ichimoku Sanjin, which loosely translates to “what a man in the mountain sees.”
Ichimoku Kinkō Hyō also loosely translates to “at a glance equilibrium chart” and is among the few tools out there that provides insight and perspective on price and time.

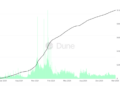
Price action is stuck between the Tenkan-sen and Kijun-sen | Source: BTCUSD on TradingView.com
The A and B Senkou Spans are plotted forward in time to show where support and resistance might lie and make up the outline of the Kumo or cloud. The Chikou Span is backward-plotted and also shows support and resistance.
Related Reading | Parabolic Bitcoin Indicator Points To Dangerous Collapse To Below $20K
Finally, the Tenkan-sen and Kijun-sen can also play the role of support and resistance, which Bitcoin price is currently sandwiched between on the monthly. The example above shows all these spans in action, and how price action has respected each level.
Importantly, depending on how the two spans are crossed can indicate if the market is bearish or bullish. The Tenkan-sen above the Kijun-sen suggests Bitcoin is bullish, and the sideways movement of the two point to a market in consolidation. 
Bitcoin is still bullish according to the last crossover | Source: BTCUSD on TradingView.com
Can The Cloud Predict The Bitcoin Top And Bottom?
Knowing how the Chikou Span works, it is clear to see that given the strength of the rally over the last several months, there is very little monthly support until $14,000 – former resistance.
If Bitcoin price loses the Kijun-sen that’s currently supporting it from below, the Chikou Span must hold next or its the Kumo or cloud at around $10,000 as the target.
Another scenario has Bitcoin holding just fine at the Kijun-sen and taking back off to the final bull market high. If this happens, the Kumo might still come into play, but to help time when – not where – the bear market bottom ends.

Could the Ichimoku predict the next bear market bottom? | Source: BTCUSD on TradingView.com
Note that the twist in the Kumo from red to green in late 2018 set the bottom of the last bear market, the same signal now plotted forward could help to predict when Bitcoin bottoms in the next cycle.
As for where, looking at the last cycle the bottom trading range happened to be where the one red doji was during the last bull market once a new all-time high was made. If the cycle does continue from here, around $30,000 could act as the eventual bear market bottom in late 2022.
Related Reading | Bitcoin Bulls Bring Out Hammer Of Thor Reversal, But Support Must Hold
The final small green bump in the Kumo the begins in late 2021 could be where the peak takes place. However, if a bear market starts instead, things could get extremely dangerous. As you now know, the Ichimoku provides all kinds of signals “at a glance” and a Kumo twist also can represent weakness in support.
If the Kijun-Sen is lost and all other supports shredded, that Kumo twist could lead to lows that no one in crypto ever saw coming.
Featured image from iStockPhotos, Charts from TradingView.com
Credit: Source link


