• Live Crypto Prices
  • Crypto News
    • Worldwide
      • Bitcoin
      • Ethereum
      • Altcoin
      • Blockchain
      • Regulation
    • Australian Crypto News
  • Education
    • Cryptocurrency For Beginners
    • Where to Buy Cryptocurrency
    • Where to Store Cryptos
    • Cryptocurrency Tax in Australia 2021
No Result
View All Result
CryptoABC.net
No Result
View All Result

Polkadot Surged Over 4%, What Are The Technicals Indicating?

May 31, 2022
in Bitcoin
Reading Time: 4min read
0 0
A A
0
Polkadot Surged Over 4%, What Are The Technicals Indicating?
0
SHARES
6
VIEWS
ShareShareShareShareShare

Polkadot recovered on its chart, over the last 24 hours the coin surged over 4%. Over the past week, the altcoin did not register much price movement.

The altcoin painted a bullish picture today with technical outlook pointing towards a change in price action. The coin regained its lost value quite a bit considering DOT flashed signs of revival.

Polkadot has been breaking past resistance lines one after the other and at the moment the coin could aim at its overhead price ceiling.

Price started to pick up momentum ever since it moved past the $9 price level. The aforementioned price level is now acting as a support level. Buying pressure returned in the market which indicated that DOT was regaining its bullish price action.

Polkadot Price Analysis: One Day Chart

Polkadot was trading at $10.27 on the one day chart | Source: DOTUSD on TradingView

DOT was priced at $10.27 at the time of writing. The nearest price floor stood at $9, the other support lines stood at $8.71 and $7.20.

Overhead resistance for the coin stood at $11.87, the coin had attempted to trade above the $11 so if the bulls push a little harder then the coin can retest the aforementioned level.

If the coin continues to trade above the $11 then the altcoin could manage to trade near the $14.62. The volume of the coin was seen in the green which indicated that the coin was turn bullish.

This also signified that the buying pressure was increasing on the chart.

Technical Analysis

Polkadot
Polkadot saw an increase in buying strength on the one day chart | Source: DOTUSD on TradingView

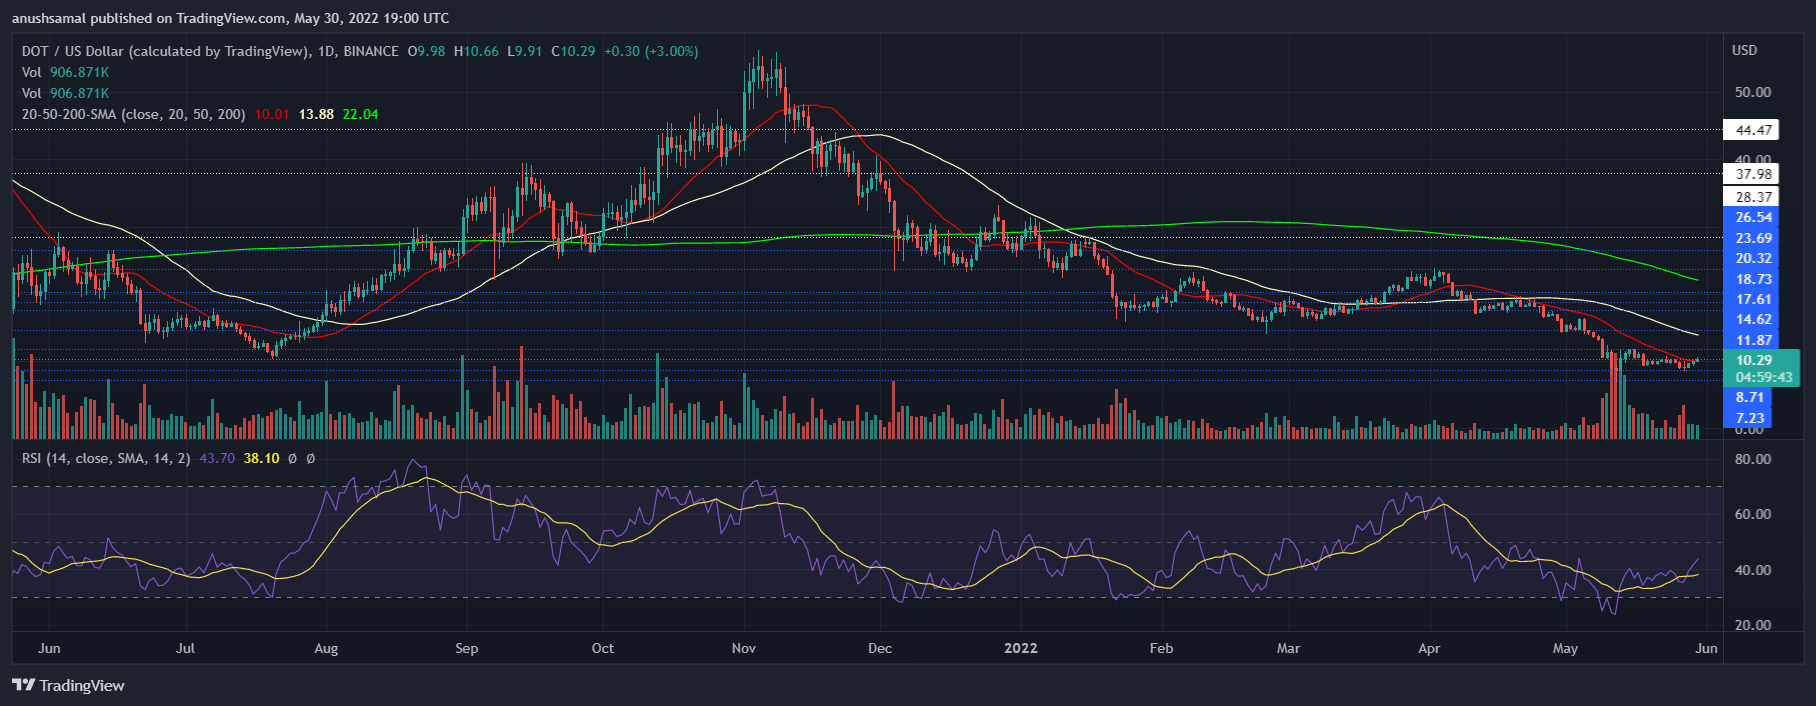
DOT started to display changes in price and the technical pointed towards bullishness. The coin after it surged, tried to rise above the 20-SMA line.

At the time of the writing, the coin stood above the 20-SMA line. This indicated that buyers were in charge on the price momentum in the market.

The Relative Strength Index noted an uptick on the one day chart. This was in accordance with the above indicator which displayed a rise in buying strength.

Related Reading | Negative Sentiment Deepens In Crypto, Why Recovery May Not Last

Polkadot
Polkadot displayed a buy signal on the one day chart | Source: DOTUSD on TradingView

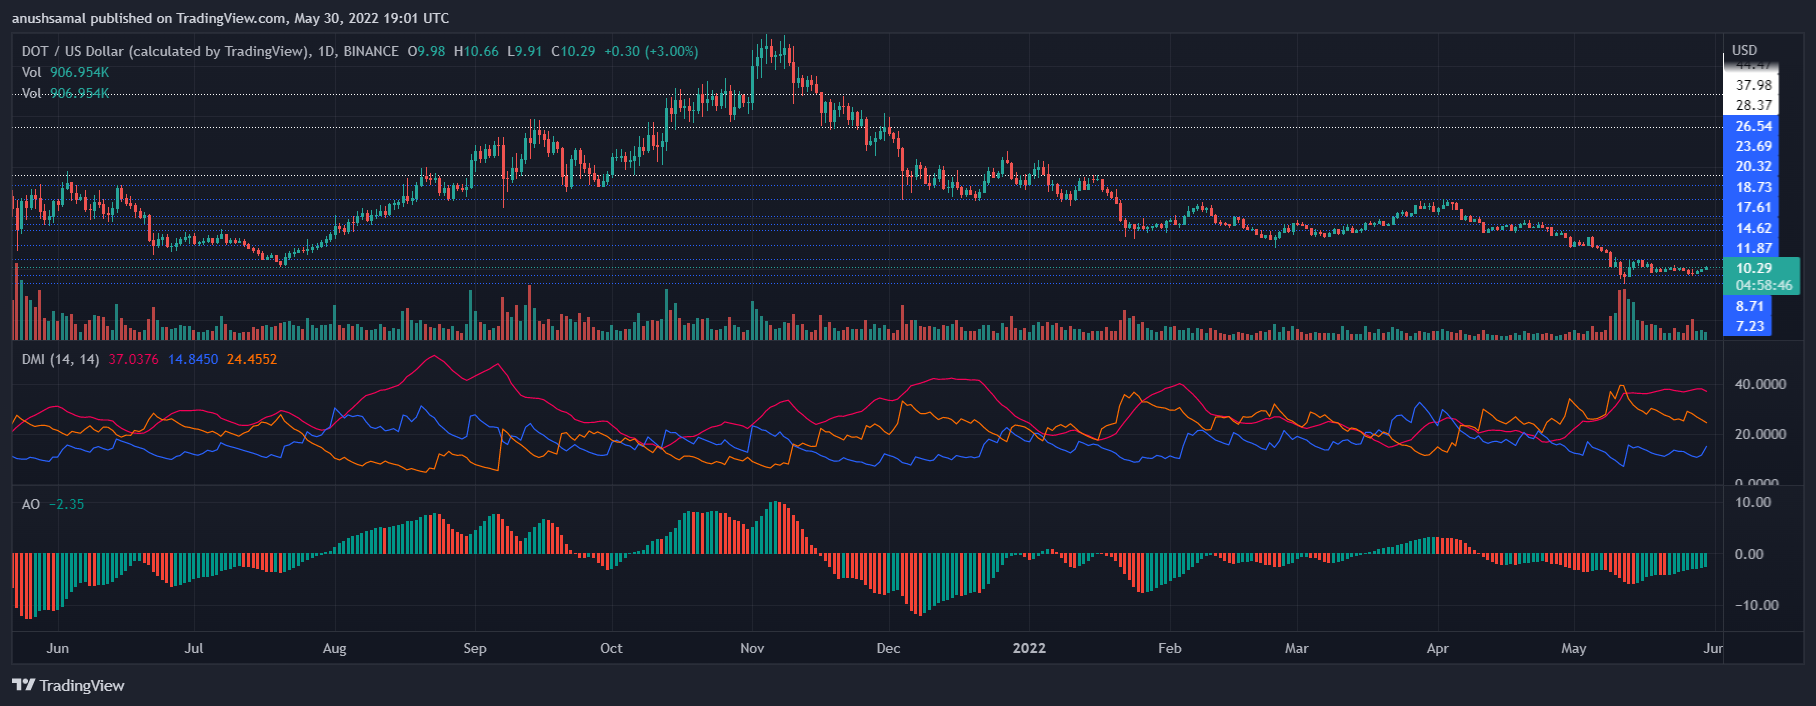
Polkadot registered a buy signal as soon as the buyers came back in the market. Awesome Oscillator depicted green signal bars. The indicator depicts the price momentum of the market.

The green signal bars also indicate a buying signal. If the buyers continue to act on it, the price could move above the overhead resistance.

The Directional Movement Index was turning positive as the +DI line was slowly moving upwards. The

Average Directional Index (Red) was above the 40-mark, this depicted the strength in the price momentum at the time of writing. For Polkadot to maintain its current price action, broader market strength would be required.

Related Reading | Polkadot (DOT) Trades Beneath $11; How Soon Will It Target $14?

Credit: Source link

ShareTweetSendPinShare
Previous Post

Bitcoin Revisits $32K, Why Dips Remain Attractive In Near-Term

Next Post

Ethereum Tests $2K, Why ETH Could Extend Rally

Next Post
Ethereum Sets New ATH, Why Dips Remain Attractive In Near-Term

Ethereum Tests $2K, Why ETH Could Extend Rally

You might also like

Iran enrichment end deadline looms as Polymarket odds favor No

Iran enrichment end deadline looms as Polymarket odds favor No

June 2, 2026
Ethereum Breakdown Warning: This Key Level Could Trigger More Downtrend

Ethereum Breakdown Warning: This Key Level Could Trigger More Downtrend

June 7, 2026
Are Institutions Crashing The Bitcoin Price On Purpose? Here’s What People Are Saying

Are Institutions Crashing The Bitcoin Price On Purpose? Here’s What People Are Saying

June 5, 2026
Bitcoin Holders Signal Stress, $60K Becomes Critical Battleground

Bitcoin Holders Signal Stress, $60K Becomes Critical Battleground

June 4, 2026
Why Is Crypto Up Today? – October 15, 2025

Bitcoin News: BTC USD Just Hit Its Lowest Level Since February

June 4, 2026
XRP To $1,000? Expert Lays Out Macro Domino Theory

XRP To $1,000? Expert Lays Out Macro Domino Theory

June 1, 2026
CryptoABC.net

This is an Australian online news/education portal that aims to provide the latest crypto news, real-time updates, education and reviews within Australia and around the world. Feel free to get in touch with us!

What's New Here!

Dogecoin (DOGE) Stages A Recovery Attempt After A Brutal Selloff

Dogecoin (DOGE) Stages A Recovery Attempt After A Brutal Selloff

June 8, 2026
XRP Price Climbs Off Recent Lows With Fresh Upside Momentum

XRP Price Climbs Off Recent Lows With Fresh Upside Momentum

June 8, 2026

Subscribe Now

  • Contact Us
  • Privacy Policy
  • Terms of Use
  • DMCA

© 2021 cryptoabc.net - All rights reserved!

No Result
View All Result
  • Live Crypto Prices
  • Crypto News
    • Worldwide
      • Bitcoin
      • Ethereum
      • Altcoin
      • Blockchain
      • Regulation
    • Australian Crypto News
  • Education
    • Cryptocurrency For Beginners
    • Where to Buy Cryptocurrency
    • Where to Store Cryptos
    • Cryptocurrency Tax in Australia 2021

© 2021 cryptoabc.net - All rights reserved!

Welcome Back!

Login to your account below

Forgotten Password?

Create New Account!

Fill the forms below to register

All fields are required. Log In

Retrieve your password

Please enter your username or email address to reset your password.

Log In
Please enter CoinGecko Free Api Key to get this plugin works.