Polkadot (DOT) has held itself for sometime at the current price level. The consistent downslide of major market movers have pushed many altcoins near their immediate support and below their nearest resistance levels. Recent market conditions have been quite harsh for investors.
The returns have been questionable. Polkadot (DOT) has witnessed a sharp fall in buying strength owing to the same bearish condition of the market. The coin has been in the limelight in the recent times due to the latest development.
These developments are related to interoperability and features of multi-chain which was announced in the middle of this month. These activities have helped buyers to enter the market. Selling pressure however, continue to outpower buying pressure in the market.
Polkadot now has an ecosystem which is consistently striving to bring new projects through para-chain auctions. It is still uncertain if over the upcoming trading sessions that coin can maintain its price action and touch its immediate resistance mark.
Polkadot Price Analysis: One Day Chart
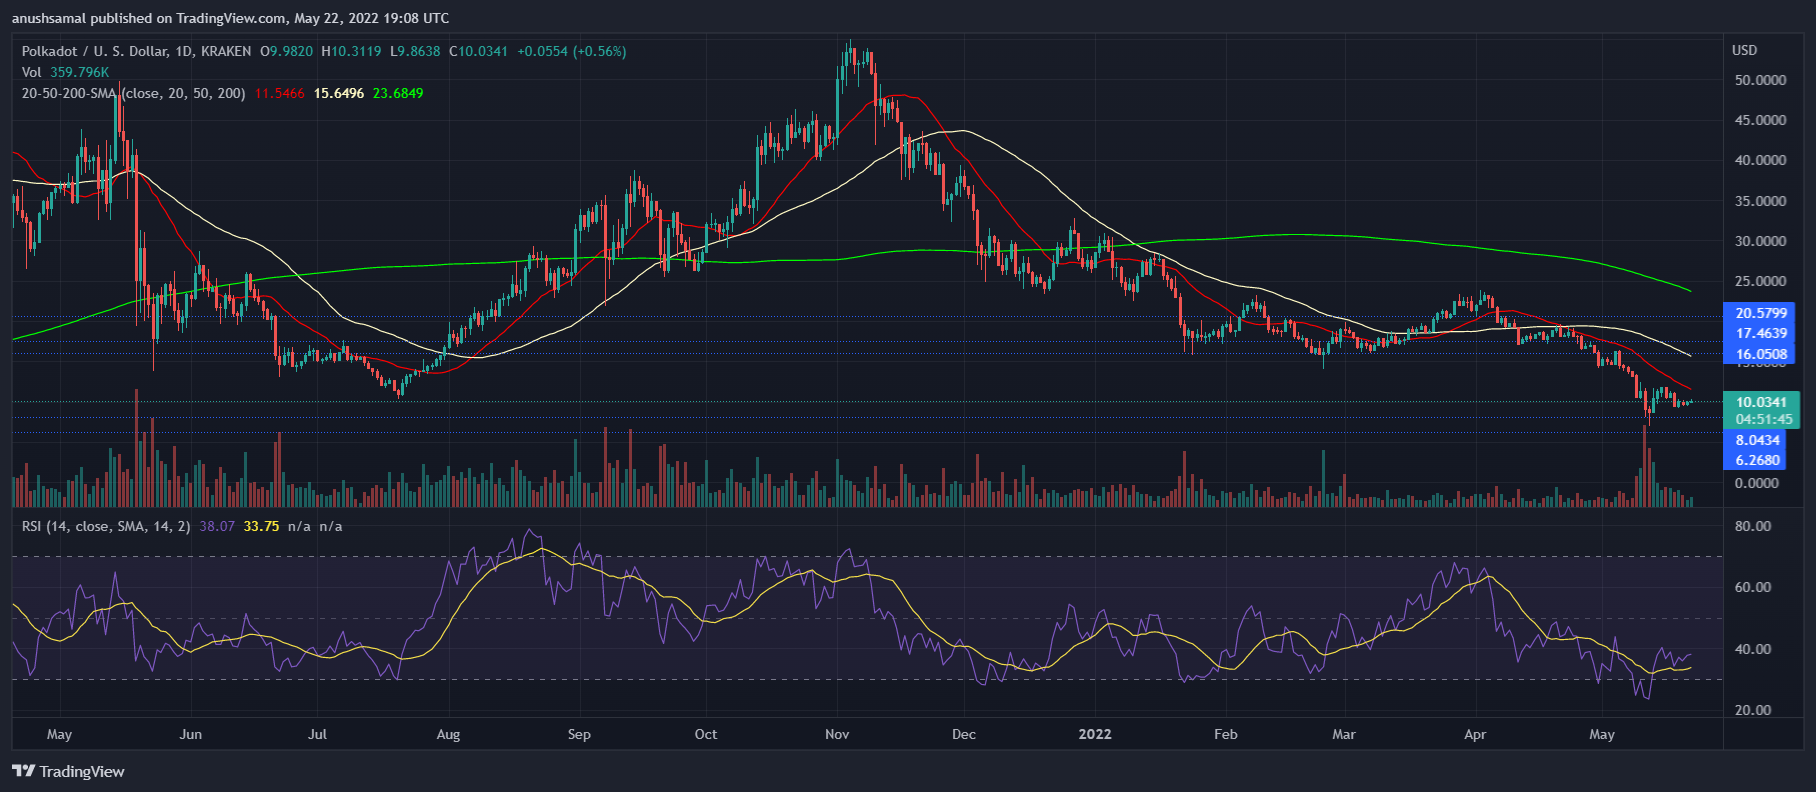
The altcoin was priced at $10 at the time of writing and after several rejections from the $11 level. Nearest support level for the altcoin stood at $8 and a fall beneath that could land DOT near $6.26. Over the last 48 hours, DOT broke below its 10 month long support line.
In the past 24 hours, the coin tried to move northwards but the bulls have tired out. The lack of buyers have caused the bullish action to fizzle out. Trading volume was seen in green which is a sign of positive price action, however, another session dominated by sellers could change that.
Technical Analysis

As mentioned above, Polkadot (DOT) has undergone quite a bit of developments recently and that could have helped the investors gain confidence. On the Relative Strength Index, the indicator stood below the half-line but noted an uptick.
This uptick signified buyers re-entering however, lacklustre price action caused buyers to remain wary. In accordance to the same, DOT remained below the 20-SMA which is considered bearish. The sellers were still in charge of driving the price momentum according to the aforementioned reading.
A slight push from the bears could help DOT rise above the 20-SMA which could then make the price reversal steady.
Related Reading | Polkadot Displayed Bearish Engulfing Candlestick; Suggests Further Downtrend

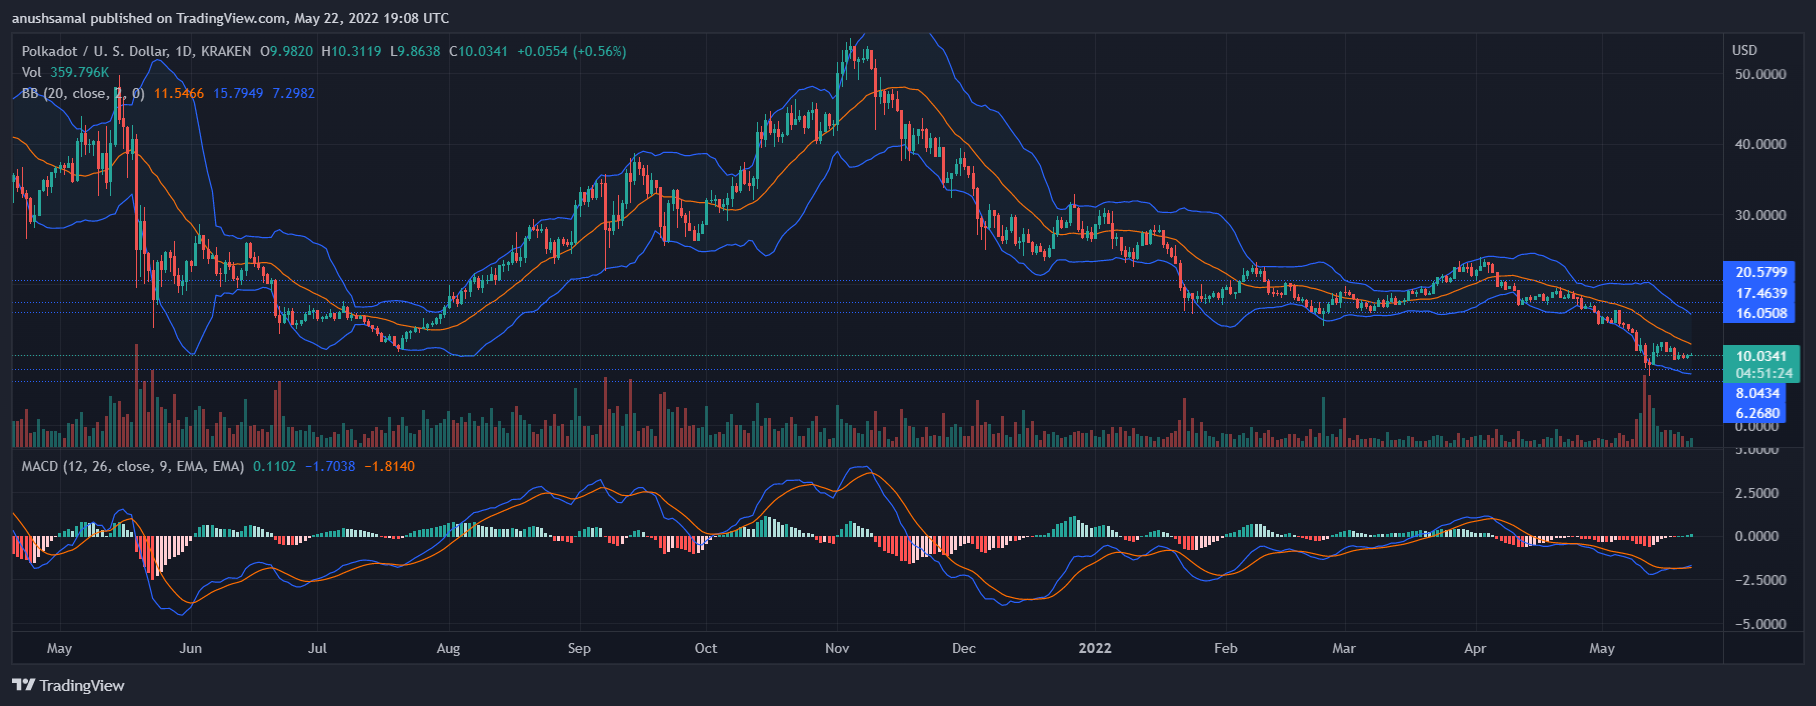
Polkadot might target $14 if the current price action picks up a bit of momentum. Moving Average Convergence Divergence indicates price momentum. MACD flashed green histograms just above the half-line and that refers to a buy signal.
If buyers act on it then price of the altcoin could witness some relief. Bollinger Bands depict price volatility of the coin, a squeeze means chances of price fluctuations. At press time though, Bollinger Bands flashed nearly parallel movement indicating a stability in DOT’s price movement.
Related Reading | Nox Bitcoin To Refund UST At $1 To Their Customers
Credit: Source link


