• Live Crypto Prices
  • Crypto News
    • Worldwide
      • Bitcoin
      • Ethereum
      • Altcoin
      • Blockchain
      • Regulation
    • Australian Crypto News
  • Education
    • Cryptocurrency For Beginners
    • Where to Buy Cryptocurrency
    • Where to Store Cryptos
    • Cryptocurrency Tax in Australia 2021
No Result
View All Result
CryptoABC.net
No Result
View All Result

MATIC Price Enters Recovery Mode But Can It Touch $0.90?

December 23, 2022
in Bitcoin
Reading Time: 4min read
0 0
A A
0
MATIC Price Enters Recovery Mode But Can It Touch $0.90?
0
SHARES
6
VIEWS
ShareShareShareShareShare

The MATIC price has remained bearish for most of this month. Presently, MATIC is attempting to correct its price. Over the last 24 hours, the coin is up by 2%. In the past week, however, the coin has depreciated by over 8%. Although, securing daily gains has helped the altcoin reverse some of its weekly losses.

With Bitcoin consolidating at the moment, many altcoins are unable to break past their immediate resistance. The technical outlook for MATIC was bearish, but certain indicators pointed towards a potential rally in the upcoming trading sessions.

The buying strength remained low, which means that accumulation was also lower on the chart. For prices to propel above the immediate price ceiling, buyers have to surpass sellers. As the altcoin logged gains over the last 48 hours, MATIC now has a strong support region extending from $0.70 to $0.63.

As MATIC traded laterally between different price zones for weeks of this month, investors have remained worried. This caused sellers to short the asset, resulting in increased selling pressure. The altcoin currently presents an entry opportunity as the bulls are slowly making a comeback in the market. The amount of altcoin traded in the last session fell, which still points to a bearish presence.

MATIC Price Analysis: One-Day Chart

MATIC was priced at $0.80 on the one-day chart | Source: MATICUSD on TradingView

The altcoin was exchanging hands at $0.80 at the time of writing. After a period of consolidation, it has finally started to register gains. The coin’s overhead price ceiling was $0.82; if that was breached, MATIC could attempt to return to or even exceed the $0.90 mark.

The $0.82 level has previously acted as a platform for a rally in the altcoin’s case. On the flip side, if unable to rest above the $0.77 mark, the price will first fall to $0.70 and then to $0.67. The amount of MATIC traded in the last session was in red, indicating that sellers were still active on the daily chart.

Technical Analysis

MATIC Price
MATIC showed signs of an incoming rally on the one-day chart | Source: MATICUSD on TradingView

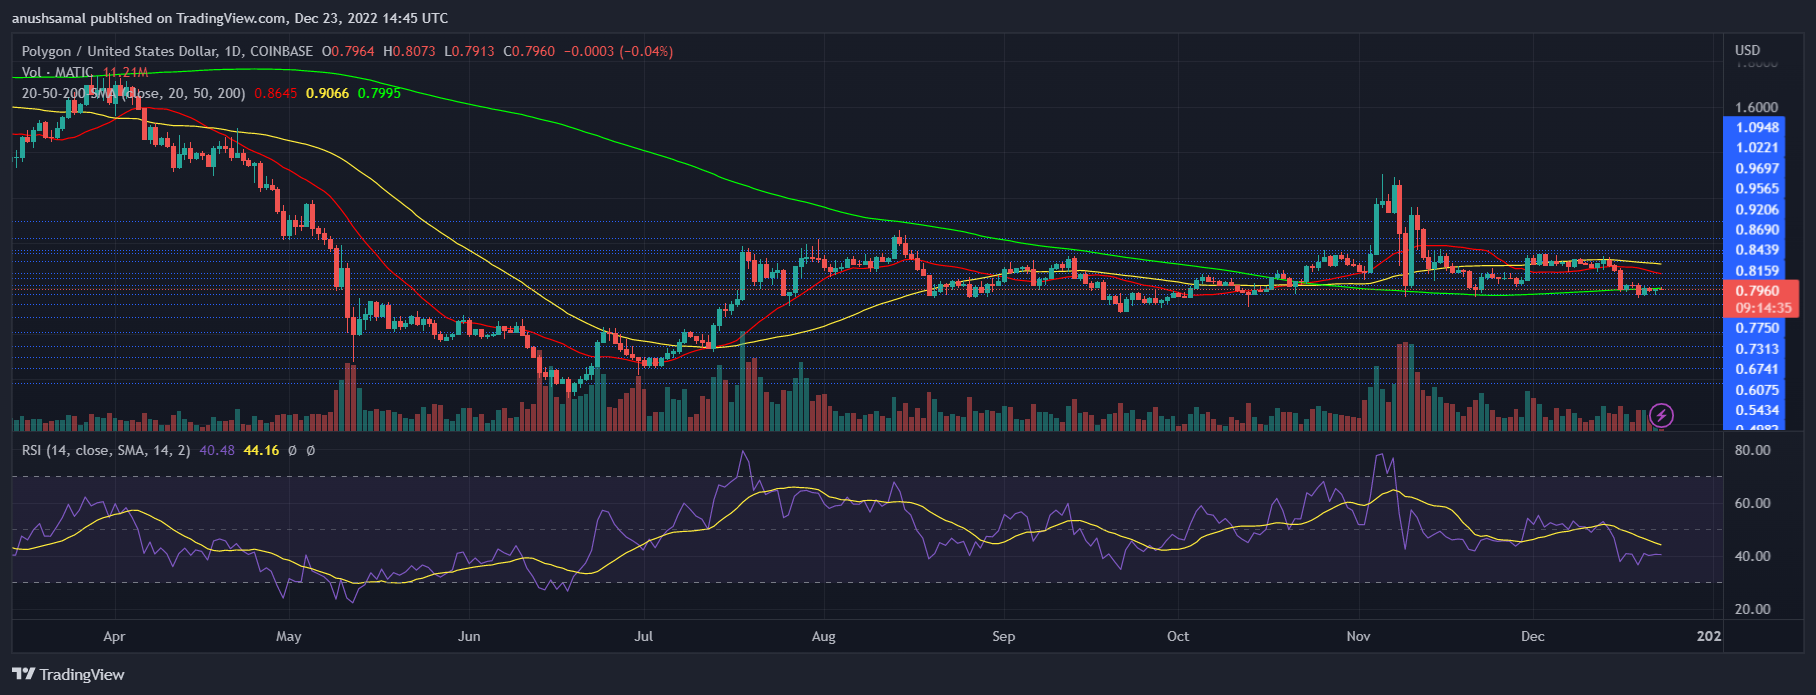
Buying strength has remained low due to increased shorting over the past few weeks. The Relative Strength (RSI) Index stood at 40, which indicated that even though buyers were making a comeback, sellers remained strong. However, there has been an uptick in the RSI over the last few days.

MATIC’s price was below the 20-Simple Moving Average (SMA) line, which demonstrates that sellers were driving the price momentum.

On the other hand, MATIC’s price was attempting to move above the 200-SMA line (green below) which paints an extremely bullish picture. This meant that the altcoin could soon move above the $0.82 resistance mark and rally up.

MATIC Price
MATIC depicts a decrease in sell signal on the one-day chart | Source: MATICUSD on TradingView

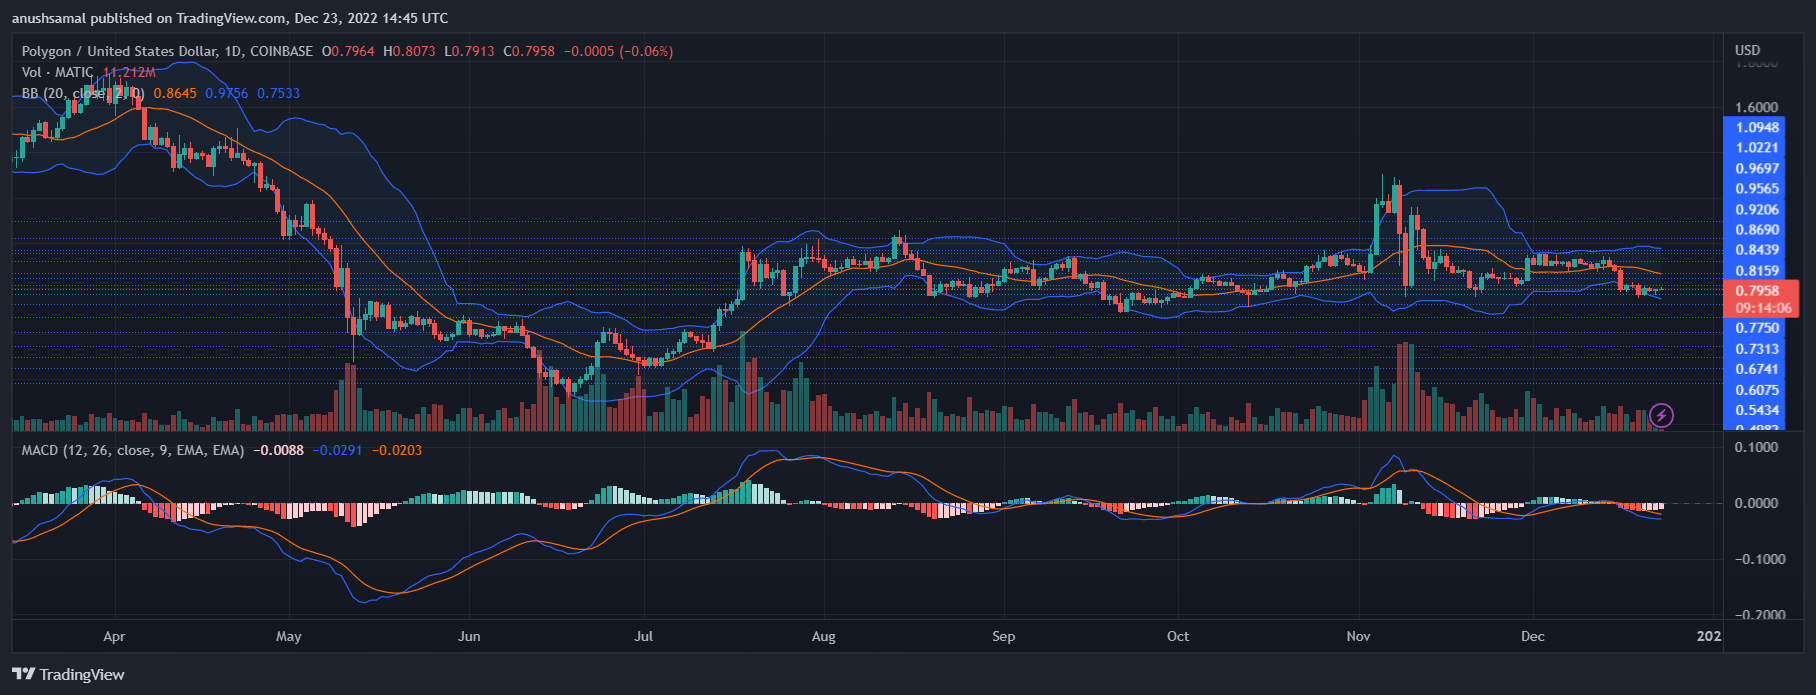
In accordance with the entry point for buyers, the Moving Average Convergence Divergence (MACD) painted fading red signal bars. These declining red signal bars are tied to the decline in the sell signal for the altcoin, which also means shorting currently might not be a good idea.

Related Reading: Ethereum Price Key Trend is Forming and Swift Recovery Could Occur

The MACD depicts the change in price momentum, and these bars portray that the indicator could reflect bullish signals over the next trading sessions. The Bollinger Bands indicate the volatility in the market. The bands were wide, meaning that the price could touch the upper band at $0.84.

Featured Image From UnSplash, Charts From TradingView.com

Credit: Source link

ShareTweetSendPinShare
Previous Post

Ripple CEO Brad Garlinghouse Says $3,700,000,000 Wells Fargo Violation Overshadowed by FTX

Next Post

Joint Operation Dismantles $16M-heavy Crypto Fraud, Kraken Pro and Kraken NFT Go Live, OpenSea Blocks 30 Cuban Creators

Next Post
Joint Operation Dismantles $16M-heavy Crypto Fraud, Kraken Pro and Kraken NFT Go Live, OpenSea Blocks 30 Cuban Creators

Joint Operation Dismantles $16M-heavy Crypto Fraud, Kraken Pro and Kraken NFT Go Live, OpenSea Blocks 30 Cuban Creators

You might also like

How BlackRock And Mastercard Are Tapping XRP To Dominate DeFi

How BlackRock And Mastercard Are Tapping XRP To Dominate DeFi

April 24, 2026
Uzbekistan Lures Global Crypto Mining with 10-Year Tax Holiday in New Special Zone

Uzbekistan Lures Global Crypto Mining with 10-Year Tax Holiday in New Special Zone

April 23, 2026
Crypto Markets Rattle As Bitcoin Sinks Under $77K After Oil Spike

Crypto Markets Rattle As Bitcoin Sinks Under $77K After Oil Spike

April 29, 2026
AI-Powered Crypto Trading Tools That Don’t Require Coding Skills: Review

BNB Chain Just Activated the Osaka Hard Fork: Will 20,000 TPS Finally Trigger a Price Breakout Above $700?

April 28, 2026
Soldier Charged After Betting on Secret Maduro Arrest Using Classified Intel

Soldier Charged After Betting on Secret Maduro Arrest Using Classified Intel

April 24, 2026
XRP News: Ripple’s CEO Expects CLARITY Act by May and Coinbase Is Activating XRP Futures: Are the Catalysts Finally Aligning?

XRP News: Ripple’s CEO Expects CLARITY Act by May and Coinbase Is Activating XRP Futures: Are the Catalysts Finally Aligning?

April 29, 2026
CryptoABC.net

This is an Australian online news/education portal that aims to provide the latest crypto news, real-time updates, education and reviews within Australia and around the world. Feel free to get in touch with us!

What's New Here!

Bitcoin Price Prediction: Iran Hormuz Toll Might Spark BTC USD Rally to $100K

US Treasury vs. Tehran: Iran in Bitcoin Cat and Mouse Game

April 30, 2026
Fidelity Flags Bitcoin Price Zone That Historically Marked Accumulation

Fidelity Flags Bitcoin Price Zone That Historically Marked Accumulation

April 30, 2026

Subscribe Now

  • Contact Us
  • Privacy Policy
  • Terms of Use
  • DMCA

© 2021 cryptoabc.net - All rights reserved!

No Result
View All Result
  • Live Crypto Prices
  • Crypto News
    • Worldwide
      • Bitcoin
      • Ethereum
      • Altcoin
      • Blockchain
      • Regulation
    • Australian Crypto News
  • Education
    • Cryptocurrency For Beginners
    • Where to Buy Cryptocurrency
    • Where to Store Cryptos
    • Cryptocurrency Tax in Australia 2021

© 2021 cryptoabc.net - All rights reserved!

Welcome Back!

Login to your account below

Forgotten Password?

Create New Account!

Fill the forms below to register

All fields are required. Log In

Retrieve your password

Please enter your username or email address to reset your password.

Log In
Please enter CoinGecko Free Api Key to get this plugin works.