Let’s take a closer look at today’s altcoins showing breakout signals. We’ll explain what the coin is, then dive into the trading charts and provide some analysis to help you decide.
1. Polygon (MATIC)
Polygon MATIC is the first well-structured, easy-to-use platform for Ethereum scaling and infrastructure development. Its core component is Polygon SDK, a modular, flexible framework that supports building multiple types of applications. The MATIC token will continue to exist and will play an increasingly important role in securing the system and enabling governance.
MATIC Price Analysis
At the time of writing, MATIC is ranked the 20th cryptocurrency globally and the current price is US$0.3749. Let’s take a look at the chart below for price analysis:

Since its Q1 highs, MATIC has been in a steady bearish trend, retracing nearly 75%. The price found support near $0.3520, at the 65.8% retracement level.
Last week’s sharp impulse up might have marked the start of a new trend. If so, higher timeframes suggest that $0.3639 near the 65.8% retracement and the 9, 18, and 40 EMAs may see interest from bulls. The price could reach lower, near $0.3320, and still find support.
Currently, the price is contesting a region between $0.3039 and $0.3135. Closes over this level could confirm it as new support, leading to a move higher.
However, bulls are contending with probable resistance near $0.4631, while $0.5470 is also likely to be sensitive with the nearest support and resistance this close together.
2. Fantom (FTM)
Fantom FTM is a directed acyclic graph (DAG) smart contract platform providing decentralised finance (DeFi) services to developers using its own bespoke consensus algorithm. Together with its in-house token FTM, Fantom aims to solve problems associated with smart-contract platforms – specifically transaction speed, which developers say they have reduced to under two seconds.
FTM Price Analysis
At the time of writing, FTM is ranked the 64th cryptocurrency globally and the current price is US$0.2189. Let’s take a look at the chart below for price analysis:

FTM‘s bounce during Q2 ran into resistance near the old monthly highs. This rejection created a set of relatively equal highs near $0.4267, possibly forming the next bullish leg’s target.
Currently, the price is testing possible support near the weekly open, around $0.2061. This level also has confluence with the 80.6% retracement of the current local range and the 18 and 40 EMAs.
If this level fails to provide support, a zone from $0.1834 to $0.1730 might mark a possible swing low or consolidation area. This zone is between the 65.8% and 78.6% retracement of early 2021 August’s swing.
A more bearish tone in the market could propel the price lower. The lows, near $0.1530, might mark an area of possible support as well as a bearish target.
3. The Sandbox (SAND)
The Sandbox SAND is a blockchain-based virtual world allowing users to create, build, buy and sell digital assets in the form of a game. By combining the powers of decentralised autonomous organisations (DAOs) and non-fungible tokens (NFTs), the Sandbox creates a decentralised platform for a thriving gaming community. The Sandbox employs the powers of blockchain technology by introducing the SAND utility token, which facilitates transactions on the platform.
SAND Price Analysis
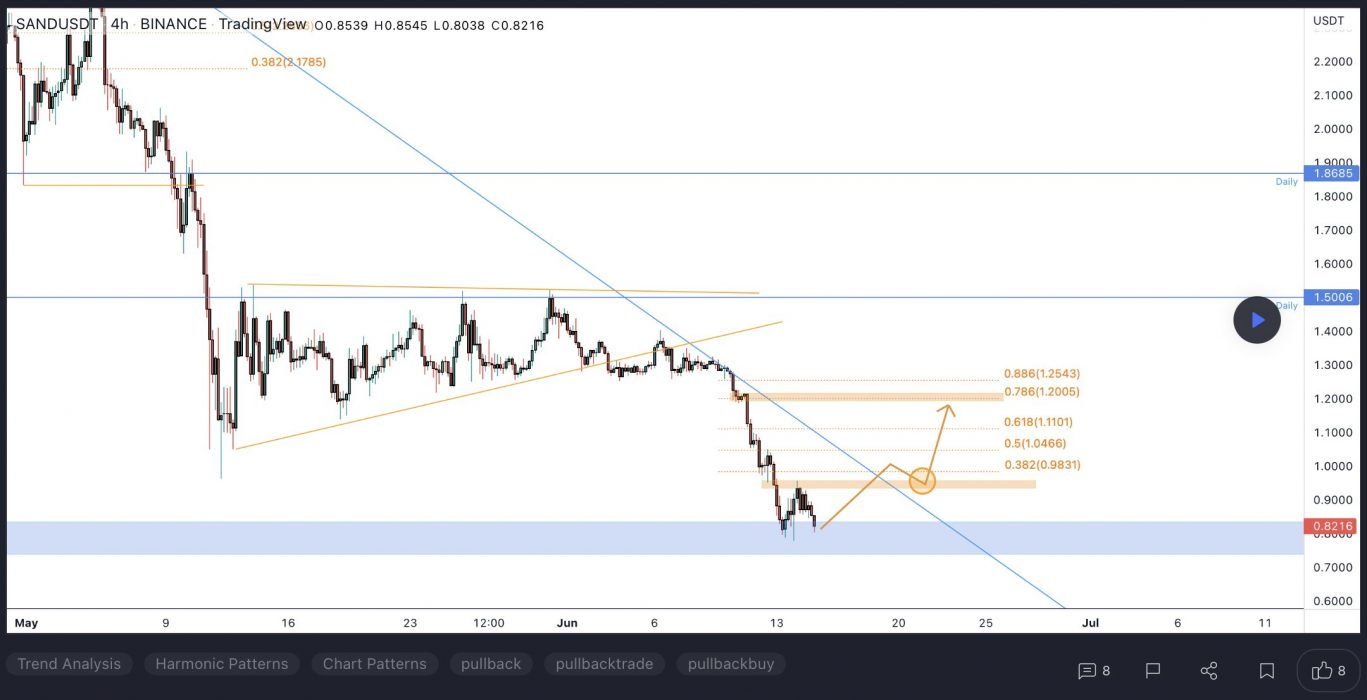
At the time of writing, SAND is ranked the 42nd cryptocurrency globally and the current price is US$0.8427. Let’s take a look at the chart below for price analysis:

SAND‘s impressive gains during Q1 halted at $2.38 before retracing 80% of the move. This price action created several areas of possible higher-timeframe resistance in the process.
The price found resistance on its last swing upward near $1.15 – an area that could provide resistance again. If this swing high breaks, the price might find resistance near $1.26. If this area does provide resistance, it would suggest the formation of a higher-timeframe consolidation.
The fast move up left little higher-timeframe support. However, a vast zone between $0.8890 and $0.8146 has provided support before and could give support again on a retest. This zone is between the 71.8%-to-88.6% retracement levels of 2021 Q4’s parabolic move.
Continuation downward through this level, especially if the overall market remains bearish, could retrace most of Q2’s move to the next higher-timeframe support near $0.7055.
Learn How to Trade Live!
Join Dave and The Crypto Den Crew and they’ll show you live on a webinar how to take your crypto trading to the next level.

Where to Buy or Trade Altcoins?
These coins have high liquidity on Binance Exchange, so that could help with trading on AUD/USDT/BTC pairs. And if you’re looking at buying and HODLing cryptos, then Swyftx Exchange is an easy-to-use popular choice in Australia.
Disclaimer:
The content and views expressed in the articles are those of the original authors own and are not necessarily the views of Crypto News. We do actively check all our content for accuracy to help protect our readers. This article content and links to external third-parties is included for information and entertainment purposes. It is not financial advice. Please do your own research before participating.
Credit: Source link


