


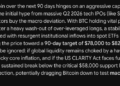
Bitcoin is hovering around the $65,000 level as persistent selling pressure continues to weigh on market sentiment. The recent decline has intensified uncertainty among investors, with volatility rising while liquidity conditions remain fragile. After a strong rally earlier in the cycle, price action now reflects a more defensive phase, with traders increasingly focused on downside risk rather than upside momentum.
Related Reading
A recent CryptoQuant report frames the central question facing the crypto market: how far this bear phase could extend before a durable bottom forms. Bitcoin has declined roughly 17% this year, a move attributed to several converging factors. These include approximately $12 billion in institutional ETF outflows over the past three months, broader global risk aversion tied to macroeconomic conditions, and ongoing regulatory ambiguity that continues to limit large-scale capital commitment.
Despite the negative backdrop, analysts note that intense institutional selling does not necessarily preclude a reversal. Historically, periods of heavy distribution often precede accumulation phases. The analytical focus is therefore shifting toward identifying a potential accumulation zone — a price range where selling pressure becomes exhausted, and larger market participants begin rebuilding exposure. That transition, if confirmed, would likely mark the early stages of trend stabilization rather than an immediate recovery.
According to the report, understanding the current Bitcoin environment requires focusing on market structure rather than short-term price forecasts. One framework gaining attention is the BTC Market Cycle Signals indicator, an on-chain analytical tool that interprets Bitcoin’s cycle through three distinct phases using monthly Bollinger Band positioning. This approach aims to contextualize volatility rather than simply react to it.
The first phase, Distribution, typically occurs when the price reaches or exceeds the upper Bollinger Band, often reflecting euphoric sentiment and profit-taking behavior. This stage historically aligns with cycle tops. The second phase, Capitulation, emerges when price declines below the 20-month moving average and gravitates toward the lower band, signaling panic, forced selling, and deteriorating sentiment. Finally, the Accumulation phase represents conditions where long-term positioning becomes favorable, although this zone does not always coincide with the exact market bottom.
Current price action appears to be converging toward the level associated with early accumulation, estimated around $54,600. Historically, this range has acted as a transitional zone between capitulation and renewed accumulation activity.
However, this should be interpreted cautiously. While such indicators help clarify cycle positioning, they do not eliminate uncertainty. Market reversals typically require confirmation through liquidity inflows, improving sentiment, and sustained structural demand rather than technical positioning alone.
Related Reading
Bitcoin continues to trade under heavy pressure, with the weekly chart showing a decisive breakdown below the $70,000 level after several weeks of weakening structure. Price recently closed near $67,200 following a sharp rejection from the mid-$90K region, confirming a clear lower-high formation and reinforcing a bearish trend continuation. The move also represents a loss of momentum after the failed recovery attempt above the 50-week moving average, which had previously acted as dynamic support during the uptrend.

Technically, Bitcoin is now trading below the 50-week and 100-week moving averages. While the 200-week average remains significantly lower near the mid-$50K area. Historically, this zone has acted as a major long-term support. Suggesting that further downside in that region cannot be ruled out if selling pressure persists. Volume expansion during the recent drop indicates distribution rather than simple low-liquidity volatility.
Related Reading
The market appears to be transitioning from a late bull-cycle correction into a potential bear-market consolidation phase. Unless Bitcoin quickly reclaims the $70K–$75K range and stabilizes above it, the probability of continued downside or prolonged sideways accumulation remains elevated in the near term.
Featured image from ChatGPT, chart from TradingView.com
Credit: Source link


