


Joerg Hiller
Oct 19, 2025 09:30
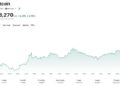
OM price falls to $0.12 as MANTRA technical analysis reveals bearish momentum building with RSI at 35.51 and trading below key moving averages in thin volume.
Quick Take
• OM trading at $0.12 (down 3.7% in 24h)
• No major catalysts driving current weakness
• Testing support near 52-week lows with RSI oversold
• Following Bitcoin’s broader market decline
Market Events Driving MANTRA Price Movement
Trading on technical factors in absence of major catalysts, MANTRA has declined 3.7% over the past 24 hours as OM price action reflects broader cryptocurrency market weakness. No significant news events have emerged in the past week that would directly impact MANTRA’s fundamentals or trading sentiment.
The current sell-off appears to be following Bitcoin’s recent weakness, with institutional participants showing reduced activity across altcoin markets. Daily trading volume of $4.48 million on Binance spot represents below-average liquidity, suggesting limited conviction from both buyers and sellers at current levels.
Without fresh catalysts to drive momentum, OM price movement has been primarily driven by technical selling as traders react to deteriorating chart patterns and weakening momentum indicators.
OM Technical Analysis: Bearish Momentum Building
Price Action Context
MANTRA technical analysis reveals a concerning setup as OM price trades significantly below all major moving averages. At $0.12, the token sits 85% below its 52-week high of $8.50 and dangerously close to the yearly low of $0.10. The 7-day simple moving average at $0.13 has provided immediate resistance, while the 20-day SMA at $0.15 represents a more significant technical hurdle.
The price structure shows OM following Bitcoin’s broader weakness but with amplified volatility typical of smaller-cap altcoins. Volume patterns suggest institutional interest remains minimal at these levels.
Key Technical Indicators
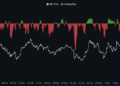
The RSI reading of 35.51 indicates oversold conditions are developing, though momentum hasn’t reached extreme levels that typically mark significant bottoms. MACD remains in negative territory at -0.0183, with the histogram showing continued bearish divergence as selling pressure persists.
Bollinger Bands positioning reveals OM price in the lower portion of the trading range, with the %B reading of 0.2292 suggesting proximity to the lower band at $0.09. This technical setup often precedes either a bounce or further breakdown depending on broader market conditions.
Critical Price Levels for MANTRA Traders
Immediate Levels (24-48 hours)
• Resistance: $0.13 (7-day moving average and recent breakdown level)
• Support: $0.10 (52-week low and psychological round number)
Breakout/Breakdown Scenarios
A break below $0.10 support could trigger accelerated selling toward the $0.03 level, representing the next major technical support zone. Conversely, a recovery above $0.15 would need to reclaim the 20-day moving average to signal any meaningful bullish reversal attempt.
OM Correlation Analysis
MANTRA continues tracking Bitcoin’s directional moves with high correlation, typical during periods of broad crypto market weakness. The token shows no significant divergence from sector peers, indicating fundamental factors specific to MANTRA aren’t currently driving price action.
Traditional market correlations remain minimal, with OM price movements primarily influenced by crypto-native factors and Bitcoin’s performance rather than equity or commodity market dynamics.
Trading Outlook: MANTRA Near-Term Prospects
Bullish Case
Recovery above $0.13 resistance accompanied by increased volume could signal short-term relief rally toward $0.15-$0.18 range. RSI oversold conditions provide potential for technical bounce if broader crypto sentiment stabilizes.
Bearish Case
Failure to hold $0.10 support risks extended decline toward $0.03 level with limited technical support between current levels. Continued low volume suggests minimal buying interest at these prices.
Risk Management
Conservative traders should consider $0.09 as maximum downside risk, representing roughly 25% below current levels. Position sizing should account for OM’s elevated volatility, with daily ATR of $0.02 representing significant intraday movement potential relative to the $0.12 price level.
Image source: Shutterstock
Credit: Source link


