


Rongchai Wang
Sep 10, 2025 18:14
OM price gains 3.18% to $0.22 as technical indicators suggest potential reversal from oversold conditions, though challenges remain below key resistance.
Quick Take
• OM currently trading at $0.22 (+3.18% in 24h)
• MANTRA’s MACD histogram turns positive, signaling potential bullish momentum shift
• No significant news catalysts in recent sessions, price action driven by technical factors
What’s Driving MANTRA Price Today?
The OM price movement today appears primarily driven by technical factors rather than fundamental news, as no significant developments have emerged for MANTRA in the past week. The 3.18% daily gain comes as traders potentially view current levels as oversold, given MANTRA’s proximity to its 52-week low of $0.20.
Trading volume of $11.16 million on Binance spot indicates moderate interest, though this remains below the levels typically seen during major breakout attempts. The absence of negative news flow has allowed technical buyers to step in at these depressed price levels.
OM Technical Analysis: Mixed Signals with Bullish Undertones
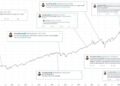
MANTRA technical analysis reveals a complex picture with several encouraging developments. The most notable bullish signal comes from MANTRA’s MACD histogram, which has turned positive at 0.0017, suggesting that bearish momentum may be waning despite the overall negative MACD reading of -0.0097.
OM RSI currently sits at 46.09, placing it in neutral territory but closer to oversold conditions. This positioning often precedes relief rallies, particularly when combined with other supportive indicators. MANTRA’s Stochastic oscillator shows %K at 57.68 above %D at 45.43, creating a potential bullish crossover scenario.
The moving average structure presents challenges for bulls, with OM price trading below the critical 50-day SMA at $0.24. However, MANTRA remains above both the 7-day SMA ($0.21) and 20-day SMA ($0.22), indicating short-term momentum may be building.
MANTRA Price Levels: Key Support and Resistance
Based on Binance spot market data, MANTRA support levels are clearly defined with immediate support at $0.19, which aligns with the lower Bollinger Band. This level has proven significant as it sits just above the 52-week low, making it a crucial line in the sand for bulls.
OM resistance faces its first test at $0.25, corresponding to both the immediate resistance level and upper Bollinger Band. A break above this zone could target the stronger resistance at $0.32, though such a move would require substantial volume confirmation.
The current Bollinger Band position shows MANTRA’s %B at 0.4756, indicating OM price sits roughly in the middle of the band range, providing room for movement in either direction.
Should You Buy OM Now? Risk-Reward Analysis
For aggressive traders, the current OM price setup offers an attractive risk-reward profile with tight stop-loss placement possible below $0.19. The proximity to MANTRA support levels means risk can be well-defined, while potential upside to $0.25 offers approximately 14% gain potential.
Conservative investors may prefer waiting for a clear break above $0.25 with volume confirmation before establishing positions. The weak overall trend, evidenced by OM price trading 97% below its 52-week high of $8.50, suggests patience may be rewarded.
Swing traders could consider dollar-cost averaging if OM/USDT continues to consolidate between current MANTRA support levels and $0.25 resistance, as the compressed volatility (ATR of $0.01) may eventually lead to a more significant directional move.
Conclusion
OM price action today suggests MANTRA may be finding a temporary bottom near $0.22, supported by improving momentum indicators and the absence of negative catalysts. However, traders should monitor the $0.25 resistance level closely, as a failure to break higher could signal continued consolidation or potential retest of support. The next 24-48 hours will be crucial in determining whether this bounce has staying power or represents another false start in MANTRA’s ongoing correction.
Image source: Shutterstock
Credit: Source link


