


Terrill Dicki
Jul 31, 2025 08:52
OM price climbs 3.01% to $0.26 in 24-hour trading, with technical indicators showing mixed signals as MANTRA approaches critical resistance levels.
Quick Take
• OM currently trading at $0.26 (+3.01% in 24h)
• MANTRA’s RSI sits at neutral 50.03, suggesting potential for further upside
• No major news catalysts driving current price action, focus shifts to technical levels
What’s Driving MANTRA Price Today?
MANTRA’s price movement today appears largely driven by technical factors rather than fundamental news, as no significant developments have emerged in the past week. The 3.01% gain brings OM price back above its 20-day simple moving average of $0.26, suggesting renewed buying interest at current levels.
The trading volume of $11.3 million on Binance spot market indicates moderate participation, though this represents healthy activity for MANTRA. Without fresh catalysts, traders are focusing on chart patterns and key technical levels to guide their positioning in OM/USDT.
OM Technical Analysis: Mixed Signals Emerge
MANTRA technical analysis reveals a complex picture for traders. OM’s RSI of 50.03 places the indicator squarely in neutral territory, neither overbought nor oversold, which typically suggests room for movement in either direction.
The MACD histogram shows -0.0023, indicating bearish momentum despite today’s price gains. This divergence between price action and momentum could signal that MANTRA’s rally may face headwinds in the near term. However, the Stochastic indicators (%K at 22.23 and %D at 18.89) remain in oversold territory, potentially supporting further upside if buying pressure continues.
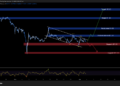
MANTRA’s Bollinger Bands paint an interesting picture, with OM price positioned at 0.4809 of the band width. The upper band sits at $0.34, providing a clear upside target, while the lower band at $0.19 offers downside protection. The current position suggests MANTRA has room to move within this range.
MANTRA Price Levels: Key Support and Resistance
Based on Binance spot market data, MANTRA support levels are well-defined. OM immediate support sits at $0.21, representing an 19% cushion from current levels. Should this level fail, MANTRA strong support at $0.19 aligns closely with the 52-week low of $0.20, making it a critical floor for bulls to defend.
On the upside, OM resistance appears formidable at $0.40, representing a 54% premium to current levels. This level has proven challenging in recent trading sessions, and breaking above it would likely trigger significant momentum for MANTRA. The Average True Range of $0.03 suggests OM could experience daily moves of this magnitude, making these levels particularly relevant for short-term traders.
The stark contrast between current OM price levels and the 52-week high of $8.50 highlights the significant distance MANTRA would need to travel to reach previous peaks, though it also illustrates the potential upside if market conditions improve dramatically.
Should You Buy OM Now? Risk-Reward Analysis
For aggressive traders, the current OM price setup offers interesting risk-reward dynamics. Entry at $0.26 with a stop-loss at MANTRA support levels of $0.21 provides a manageable 19% downside risk. The upside target at OM resistance of $0.40 offers a potential 54% gain, creating a favorable 2.8:1 risk-reward ratio.
Conservative investors might prefer waiting for a clearer signal from MANTRA technical analysis. The mixed momentum indicators suggest patience could be rewarded with better entry points, particularly if OM price retests the $0.21 support level.
Day traders should focus on the $0.03 average true range, which provides guidance on realistic profit targets within the Bollinger Bands range. The neutral RSI reading gives flexibility for both long and short positions, depending on how price reacts at key levels.
Conclusion
MANTRA’s 3% rally brings OM price to a critical juncture at $0.26, with technical indicators providing mixed signals for the next 24-48 hours. While the neutral RSI suggests room for movement, the bearish MACD histogram warns of potential momentum challenges ahead. Traders should closely monitor how OM/USDT reacts at the current resistance level, with $0.21 support and $0.40 resistance defining the near-term battleground for MANTRA.
Image source: Shutterstock
Credit: Source link


