


Ted Hisokawa
Jul 30, 2025 14:06
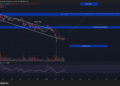
OM price trades at $0.25 after a 4.57% decline, with RSI at 46.34 showing neutral momentum while MACD signals bearish pressure for MANTRA traders.
Quick Take
• OM currently trading at $0.25 (-4.57% in 24h)
• MANTRA’s RSI sits in neutral territory at 46.34, suggesting consolidation phase
• No significant news catalysts identified in recent trading sessions
What’s Driving MANTRA Price Today?
The OM price decline appears to be driven primarily by broader market sentiment rather than specific fundamental catalysts. With no major announcements or partnerships emerging for MANTRA in recent days, the 4.57% drop reflects typical cryptocurrency volatility patterns.
The absence of fresh news has left MANTRA susceptible to technical trading patterns and general market movements. Trading volume on Binance spot reached $11.22 million over the past 24 hours, indicating moderate but not exceptional interest from traders during this consolidation period.
OM Technical Analysis: Mixed Signals Emerge
MANTRA technical analysis reveals a complex picture with conflicting momentum indicators. The OM RSI reading of 46.34 places the token in neutral territory, neither oversold nor overbought, suggesting potential for movement in either direction.
The MACD configuration presents more concerning signals for MANTRA bulls. With the MACD line at 0.0058 sitting below the signal line at 0.0080, and the histogram showing -0.0022, bearish momentum appears to be building for OM. This divergence suggests that despite the overall bullish trend classification, short-term pressure may continue.
MANTRA’s moving averages paint a mixed picture as well. The OM price currently sits below both the 7-day SMA ($0.27) and 20-day SMA ($0.26), but remains above the crucial 50-day SMA at $0.24. This positioning indicates short-term weakness but maintained medium-term support.
The Stochastic oscillator adds another layer of complexity to the MANTRA technical analysis. With %K at 14.21 and %D at 18.68, both indicators remain in oversold territory, potentially signaling an upcoming bounce for OM if buying pressure emerges.
MANTRA Price Levels: Key Support and Resistance
Based on Binance spot market data, MANTRA support levels are clearly defined with immediate support at $0.21 and strong support at $0.19. The proximity of the OM price to these levels suggests limited downside before potential buying interest emerges.
On the upside, OM resistance remains substantial at $0.40, representing both immediate and strong resistance levels. This $0.40 mark represents a 60% upside potential from current levels, making it a critical breakout target for MANTRA bulls.
The Bollinger Bands provide additional context, with OM trading near the middle band at $0.26. The %B position of 0.4008 indicates MANTRA is trading below the band center but not approaching oversold conditions. The upper band at $0.34 and lower band at $0.19 establish the current volatility range for OM/USDT trading.
Should You Buy OM Now? Risk-Reward Analysis
For conservative traders, the current MANTRA setup suggests waiting for clearer directional signals. The OM RSI in neutral territory combined with bearish MACD signals creates uncertainty that risk-averse investors may want to avoid.
Aggressive traders might consider the oversold Stochastic readings as a potential entry opportunity, especially if OM price can hold above the $0.24 level (50-day SMA). A stop-loss below $0.21 would limit downside risk while targeting the $0.30-$0.34 resistance zone.
The daily ATR of $0.03 for MANTRA indicates moderate volatility, suggesting position sizing should account for potential 12% daily moves in either direction. This volatility profile suits medium-risk trading strategies rather than conservative approaches.
Given the 52-week range from $0.20 to $8.50, current OM price levels represent significant downside from historical highs but limited cushion above the yearly low.
Conclusion
MANTRA’s current technical picture suggests a critical juncture for OM price action. While the overall trend remains classified as bullish, short-term indicators point to potential continued weakness. Traders should monitor the $0.24 support level closely, as a break below could trigger further selling toward $0.21. Conversely, a bounce from current levels with improving momentum indicators could target the $0.30-$0.34 resistance zone within the next 24-48 hours.
Image source: Shutterstock
Credit: Source link


