


Lawrence Jengar
Sep 24, 2025 15:43
OM price trades at $0.17, matching its yearly low despite modest 1.22% daily gains. Technical analysis reveals potential reversal signals with RSI at 30.26.
Quick Take
• OM currently trading at $0.17 (+1.22% in 24h)
• MANTRA’s RSI at 30.26 suggests oversold conditions may present buying opportunity
• No significant news catalysts in recent sessions, price action driven by technical factors
What’s Driving MANTRA Price Today?
The OM price movement today appears disconnected from fundamental catalysts, with no major news events emerging in the past week. This absence of newsflow has left MANTRA’s price action primarily influenced by technical trading patterns and broader market sentiment.
The modest 1.22% gain represents a potential stabilization effort after MANTRA reached its 52-week low of $0.17. Trading volume on Binance spot markets reached $6,000,511 over the past 24 hours, indicating moderate interest despite the price consolidation near yearly lows.
Without fresh fundamental drivers, traders are focusing on technical levels and momentum indicators to guide their OM positioning decisions.
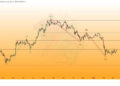
MANTRA Technical Analysis: Mixed Signals Amid Oversold Territory
The most compelling signal in current MANTRA technical analysis comes from the OM RSI reading of 30.26, placing the token firmly in oversold territory. This RSI level historically suggests potential for a technical bounce, though momentum remains fragile.
MANTRA’s MACD configuration tells a more cautious story, with the main line at -0.0114 sitting below the signal line at -0.0078. The MACD histogram reading of -0.0036 confirms bearish momentum persists for OM, though the magnitude suggests weakening selling pressure.
The Bollinger Bands analysis reveals OM positioned near the lower band at $0.18, with the current price creating a %B reading of -0.0562. This placement near the lower band often indicates oversold conditions and potential support, aligning with the RSI signals.
MANTRA’s Stochastic oscillator shows %K at 26.88 and %D at 26.32, both in oversold territory but not yet showing the divergence patterns that would signal an immediate reversal.
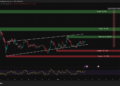
MANTRA Price Levels: Key Support and Resistance
Based on Binance spot market data, MANTRA support levels present a critical foundation for any potential recovery. The immediate support sits at $0.15, coinciding with the strong support level that has contained previous selling pressure.
OM resistance faces significant headwinds, with immediate resistance at $0.23 representing the first major hurdle. This level aligns closely with MANTRA’s 50-day SMA at $0.23, creating a confluence of technical barriers.
The more substantial resistance challenge lies at $0.30, marking MANTRA’s strong resistance zone. Any sustained move above this level would require significant volume and momentum shift to overcome the technical overhead.
MANTRA’s pivot point calculation places fair value at $0.17, exactly matching the current OM price, suggesting the market has found temporary equilibrium at these levels.
Should You Buy OM Now? Risk-Reward Analysis
For aggressive traders, the current OM price presents an asymmetric risk-reward setup. With MANTRA trading at yearly lows and technical indicators showing oversold conditions, the downside risk appears limited to the $0.15 support level, representing roughly 12% downside.
Conservative investors may prefer waiting for confirmation above the $0.20 level, where MANTRA’s short-term moving averages currently reside. This approach sacrifices early entry for reduced risk of further downside.
Swing traders should monitor the OM/USDT pair for volume expansion above $0.19, which would signal potential momentum shift. The daily ATR of $0.02 provides context for position sizing and stop-loss placement.
Risk management remains paramount given MANTRA’s proximity to support levels. Any break below $0.15 could trigger accelerated selling toward untested lower levels.
Conclusion
MANTRA’s current position at $0.17 represents a critical juncture, with technical indicators suggesting oversold conditions while trend structure remains fragile. The OM RSI reading of 30.26 provides the strongest argument for potential reversal, though broader momentum indicators counsel patience. Traders should monitor volume patterns and the $0.19-$0.20 resistance zone for signs of sustained recovery in the next 24-48 hours.
Image source: Shutterstock
Credit: Source link


