


Reason to trust
Strict editorial policy that focuses on accuracy, relevance, and impartiality
Created by industry experts and meticulously reviewed
The highest standards in reporting and publishing
Strict editorial policy that focuses on accuracy, relevance, and impartiality
Morbi pretium leo et nisl aliquam mollis. Quisque arcu lorem, ultricies quis pellentesque nec, ullamcorper eu odio.
Este artículo también está disponible en español.
Litecoin (LTC) has shown resilience amid market uncertainty and selling pressure, holding its ground despite the broader downtrend in cryptocurrencies. After retracing from $130 to the $100 mark, LTC has successfully held this crucial support, signaling that bulls are still active in defending key levels.
Related Reading
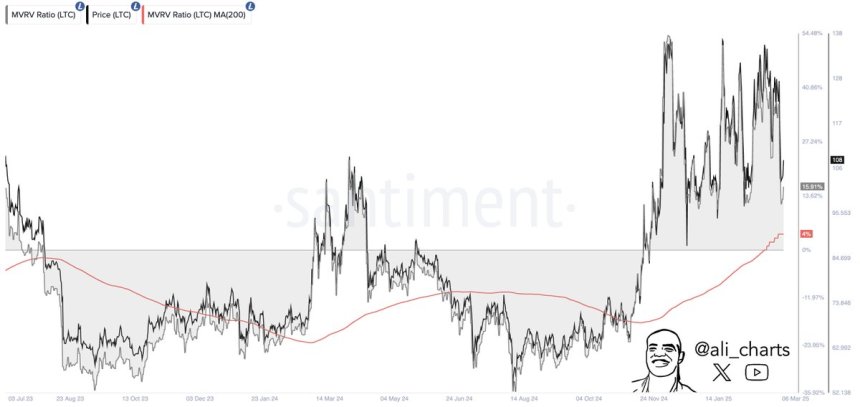
While most altcoins have struggled, Litecoin appears to maintain a slight bullish edge. According to Santiment data, LTC continues to show strength in its on-chain metrics, with the Market Value to Realized Value (MVRV) Ratio signaling a bullish outlook. This suggests that investors are still holding onto their LTC, with less incentive to sell at current levels, potentially paving the way for a recovery in the near future.
However, the coming days will be critical for Litecoin, as Bitcoin remains under pressure, struggling below key levels. Market uncertainty continues to drive volatility, and if BTC experiences further downside, LTC could face increased selling pressure. On the other hand, if Bitcoin stabilizes or pushes higher, Litecoin could quickly capitalize on its strong fundamentals and begin a renewed upward trend.
Litecoin Bulls Defend Crucial Demand
Litecoin is currently trading between key liquidity levels, navigating months of volatility and uncertainty in the broader market. Despite the recent market downturn, LTC has shown relative strength over the past few weeks, managing to hold crucial support levels while other altcoins continue to struggle.
Related Reading
However, price action remains uncertain, as Litecoin has been unable to break above key supply zones. Bulls have attempted to push the price higher, but selling pressure at resistance levels has kept LTC within a tight trading range. Until a clear breakout occurs, traders remain cautious about the next major move.
Top analyst Ali Martinez shared insights on X, highlighting that Litecoin maintains a bullish outlook based on on-chain data. According to Santiment’s MVRV Ratio, LTC is showing strength, suggesting that investors are holding onto their positions despite the market’s recent volatility. This metric often indicates whether an asset is undervalued or overvalued, and in Litecoin’s case, it signals that the coin still has strong upside potential.
If the broader crypto market starts to recover, Litecoin could emerge as one of the strongest assets, given its relative stability and bullish on-chain signals. For now, all eyes remain on LTC’s ability to hold key support levels and whether bulls can break past resistance to confirm a new uptrend.
LTC Price Action: Technical Levels To Watch
Litecoin is currently trading at $104 after facing days of selling pressure. However, despite the bearish sentiment, sellers have struggled to push LTC below the crucial $100 demand zone. This level has acted as strong support, preventing further downside, and every day that LTC holds above this mark increases the probability of a recovery move.
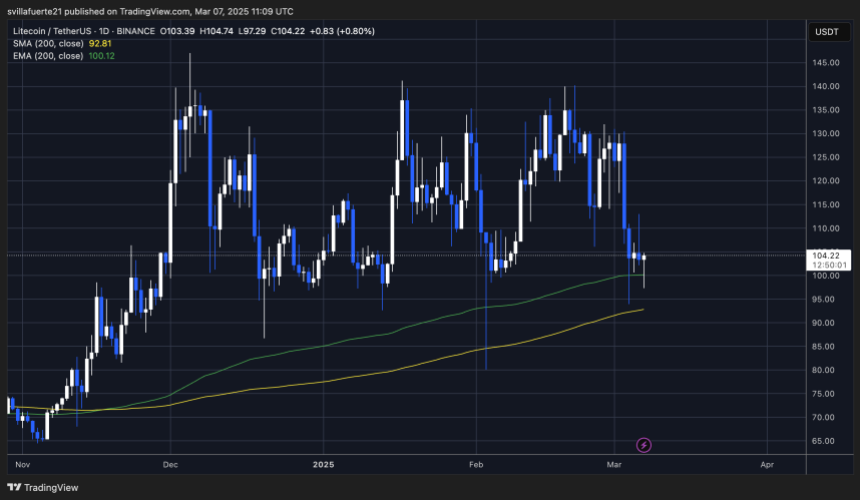
For bulls to regain control, Litecoin needs to reclaim the $115 level soon. A decisive break above this resistance could trigger renewed buying momentum, paving the way for a push into higher price levels around $130-$145. These areas represent the next major liquidity zones, where LTC could face strong resistance but also attract significant bullish interest.
Related Reading
If Litecoin continues to hold above $100, it would indicate buying confidence at lower levels, setting the stage for a potential breakout. However, failure to reclaim $115 in the short term could keep LTC in a prolonged consolidation phase, leaving its next major move uncertain.
Featured image from Dall-E, chart from TradingView
Credit: Source link


