


Luisa Crawford
Nov 17, 2025 15:42
Chainlink technical analysis shows LINK price at $13.72 near critical support as momentum indicators suggest potential bounce from oversold levels in absence of major catalysts.
Quick Take
• LINK trading at $13.72 (down 2.2% in 24h)
• Trading on technical factors with no significant news catalysts
• Testing lower Bollinger Band support at $12.95
• Following Bitcoin’s broader market weakness
Market Events Driving Chainlink Price Movement
Trading on technical factors in absence of major catalysts has characterized LINK price action over the past week. No significant news events have emerged in the past 48 hours affecting Chainlink specifically, leaving technical analysis as the primary driver for price discovery.
The current LINK price decline reflects broader cryptocurrency market weakness, with institutional traders focusing on technical support levels rather than fundamental developments. The absence of major partnership announcements or protocol updates has shifted trader attention to chart patterns and momentum indicators for directional cues.
LINK Technical Analysis: Oversold Bounce Setup
Price Action Context
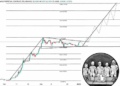
LINK price currently trades below all major moving averages, with the token sitting 23.6% below its 50-day moving average of $17.91. The positioning below the 7-day SMA at $14.34 indicates short-term bearish pressure, while the proximity to the 200-day moving average at $18.00 suggests longer-term trend resistance.
Volume analysis from Binance spot data shows $77.9 million in 24-hour trading activity, representing moderate institutional interest despite the price decline. This volume level suggests controlled selling rather than panic liquidation.
Key Technical Indicators
The daily RSI reading of 34.53 places LINK in neutral territory but approaching oversold conditions, historically a precursor to short-term bounces. The MACD histogram at -0.0761 shows bearish momentum, though the narrowing gap between MACD and signal lines suggests potential momentum shift.
Chainlink’s position at 0.1488 on the Bollinger Bands %B indicator places the token near the lower band at $12.95, a technical level that has provided support in previous downtrends. The Stochastic indicators (%K at 9.41, %D at 10.29) signal deeply oversold conditions typically associated with reversal setups.
Critical Price Levels for Chainlink Traders
Immediate Levels (24-48 hours)
• Resistance: $14.78 (12-day EMA confluence)
• Support: $13.40 (24-hour low and psychological level)
Breakout/Breakdown Scenarios
A break below $13.40 support could trigger further selling toward the $12.95 lower Bollinger Band and potentially the strong support zone at $7.90. Conversely, reclaiming the $14.78 EMA resistance would target the $15.53 20-day moving average, representing a 13% upside potential from current levels.
LINK Correlation Analysis
• Bitcoin: LINK following Bitcoin’s weakness as the leading cryptocurrency trades below key support levels
• Traditional markets: No significant correlation observed with S&P 500 movements in current session
• Sector peers: Underperforming relative to other oracle tokens amid general DeFi sector weakness
Trading Outlook: Chainlink Near-Term Prospects
Bullish Case
A successful defense of the $13.40 support level combined with RSI divergence could trigger a relief rally toward $15.53 resistance. Increasing trading volume above $100 million would confirm institutional accumulation at these oversold levels.
Bearish Case
Failure to hold $13.40 support on increasing volume could accelerate selling pressure toward the $12.95 lower Bollinger Band. A break of this technical support would open the path to test the yearly support zone near $10.93.
Risk Management
Conservative traders should consider stop-losses below $13.00 to limit downside exposure. Given the current ATR of $1.28, position sizing should account for potential 9-10% daily volatility swings in either direction.
Image source: Shutterstock
Credit: Source link


