• Live Crypto Prices
  • Crypto News
    • Worldwide
      • Bitcoin
      • Ethereum
      • Altcoin
      • Blockchain
      • Regulation
    • Australian Crypto News
  • Education
    • Cryptocurrency For Beginners
    • Where to Buy Cryptocurrency
    • Where to Store Cryptos
    • Cryptocurrency Tax in Australia 2021
No Result
View All Result
CryptoABC.net
No Result
View All Result

Is The Worst Yet To Come For XRP? Analyst Issues Dire Warning

March 1, 2025
in Bitcoin
Reading Time: 4min read
0 0
A A
0
0
SHARES
12
VIEWS
ShareShareShareShareShare

Este artículo también está disponible en español.

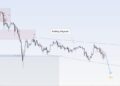
While the XRP price is already down -42% since its peak at $3.40 on January 16, renowned technical trader Josh Olszewicz (@CarpeNoctom) warns that the next leg downward may be imminent. Sharing his daily chart analysis on X, Olszewicz writes, “1D XRP: H&S + bearish kumo breakout watch,” signaling that two significant technical developments could push XRP prices lower in the near future.

Is XRP Poised To Crash Towards $1.24?

The mention of an “H&S” refers to the Head and Shoulders pattern, a well-known reversal formation in technical analysis. The pattern typically emerges after a substantial upward rally and includes three successive peaks, with the middle peak (the “head”) higher than the flanking peaks (the “shoulders”).

Related Reading

In the case of XRP, Olszewicz’s chart suggests that the central head formed around $3.40 in mid-January, while the shoulders appear to be topping out between $2.83–$2.90. Technical analysts pay close attention to the “neckline,” which generally runs along a key support level beneath the peaks. When the price decisively breaks below this neckline, it is viewed as confirmation that selling pressure has overwhelmed buying interest, often leading to further downside.

XRP price analysis
XRP H&S and bearish kumo breakout watch | Source: X @CarpeNoctom

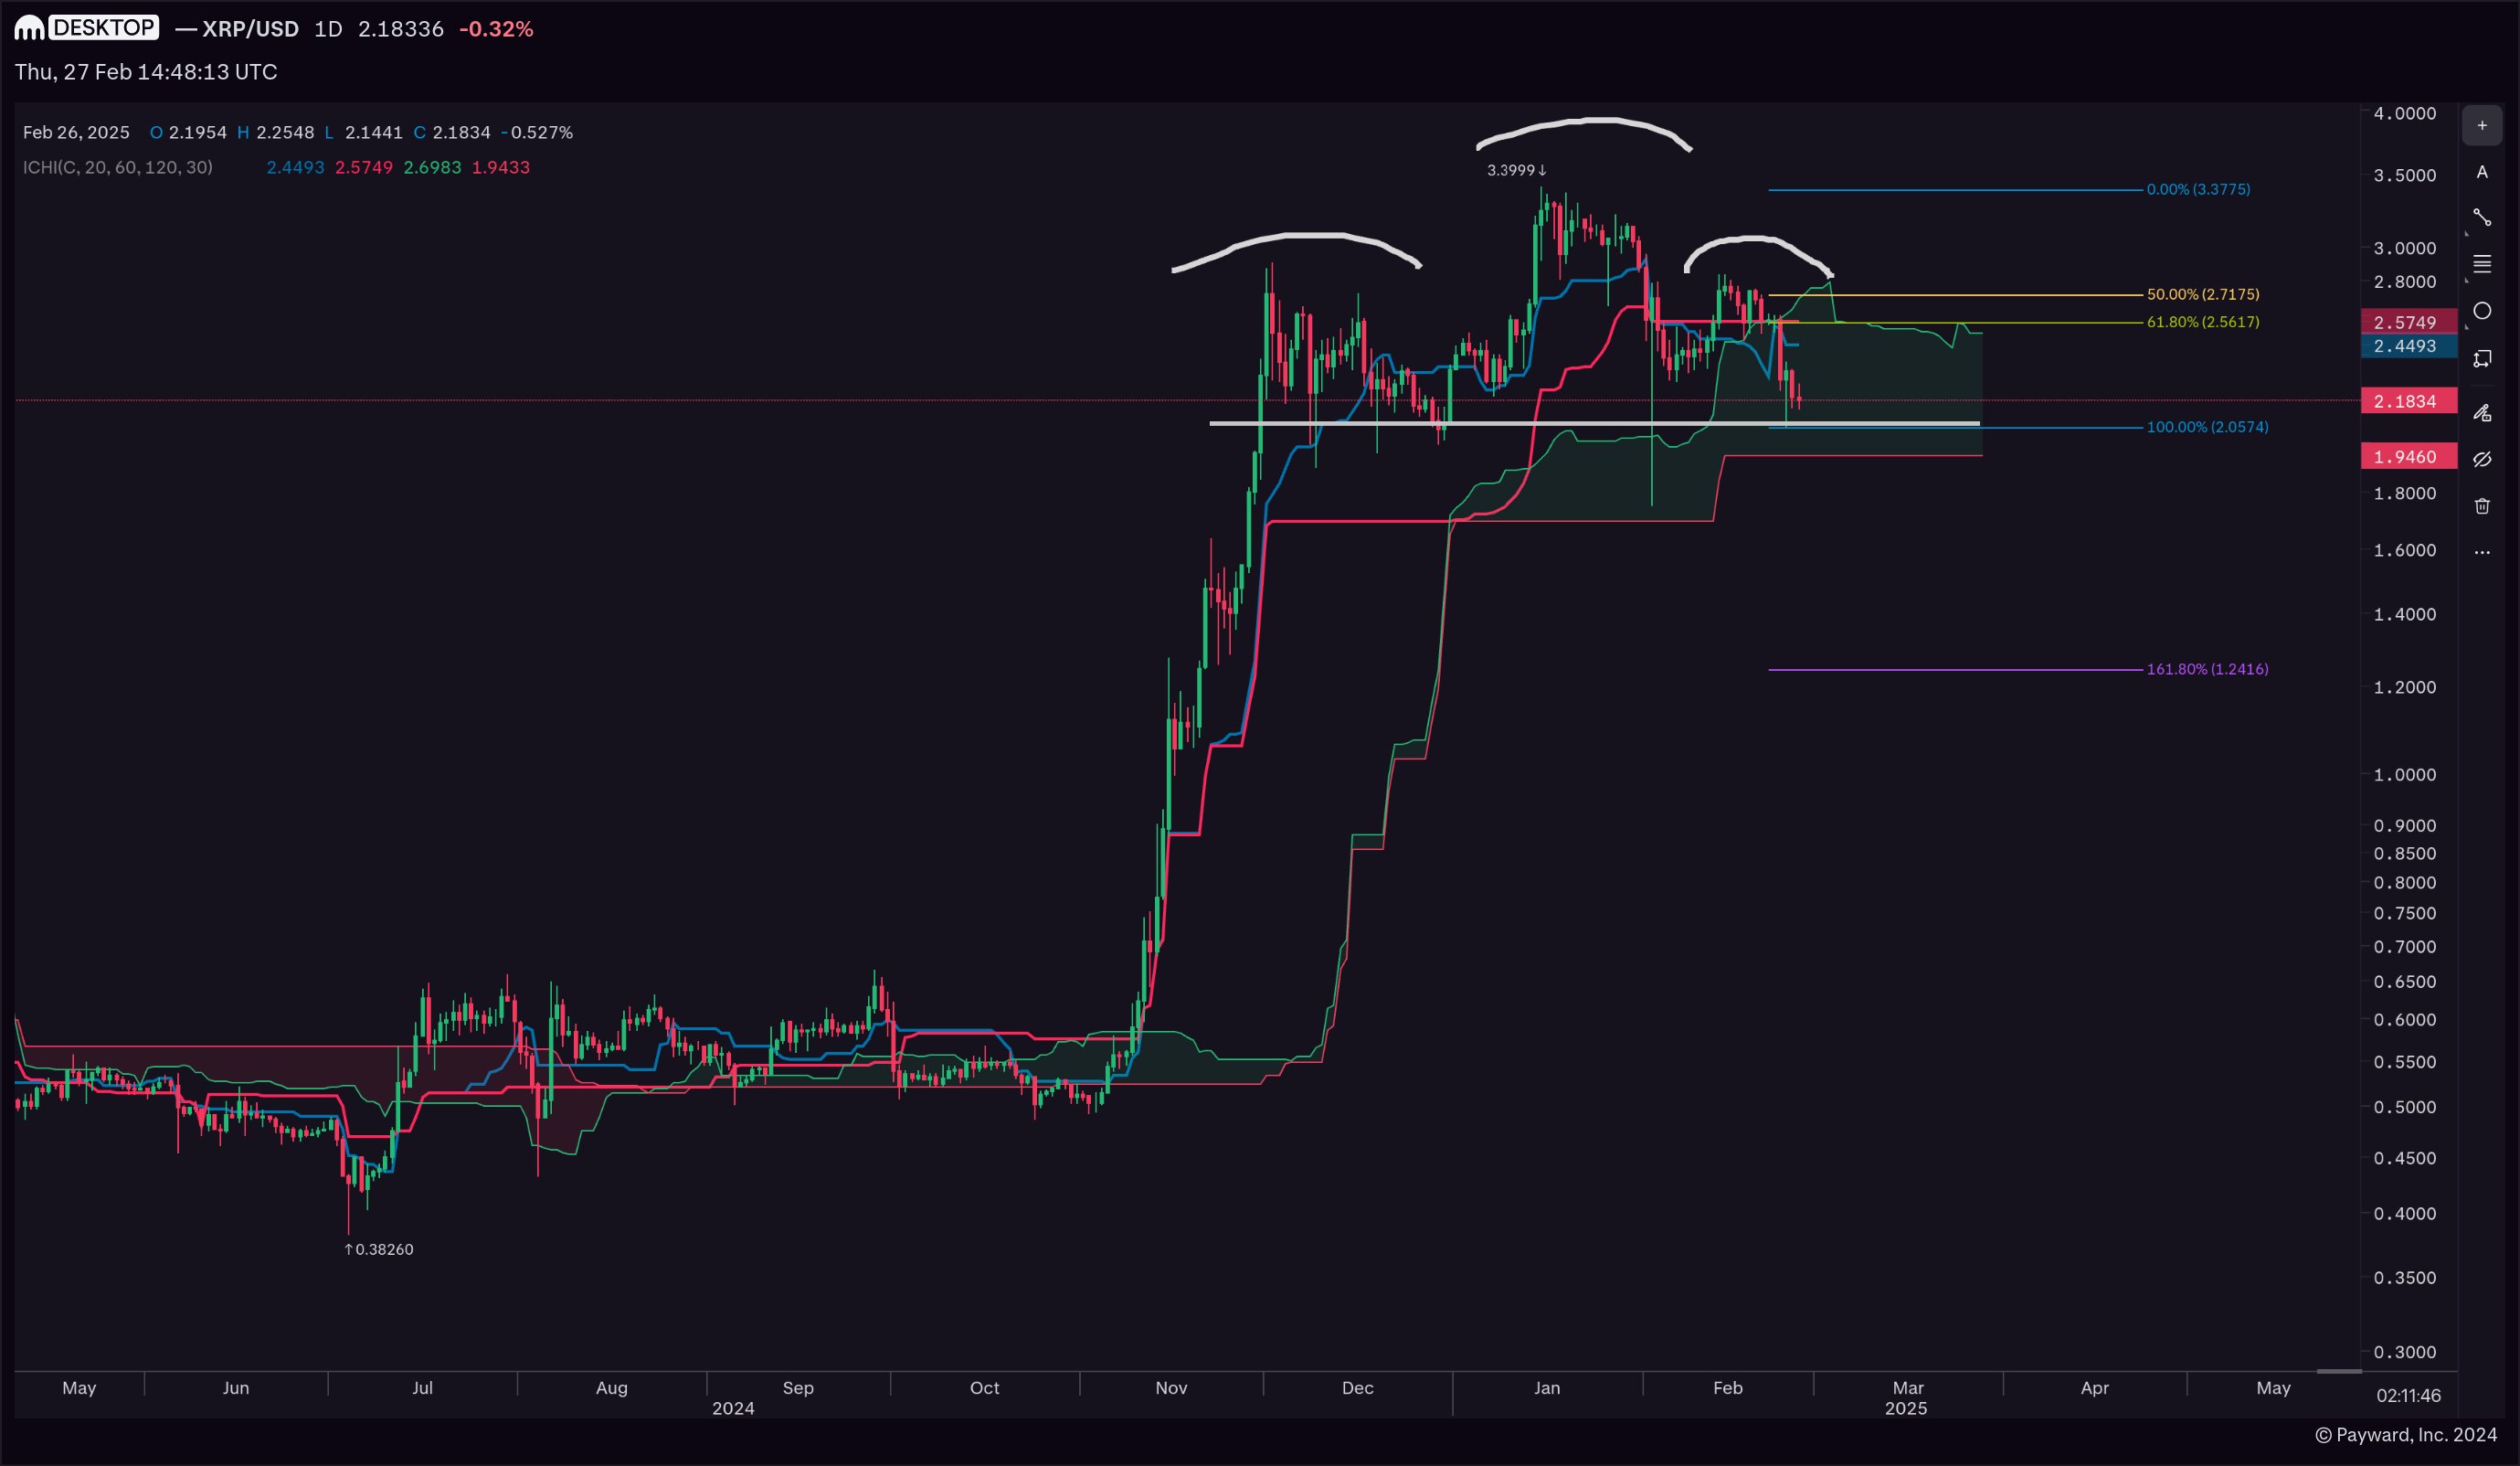
Olszewicz’s comment also highlights the phrase “bearish kumo breakout,” referencing the Ichimoku Cloud system, another prominent tool for charting and forecasting price momentum. Ichimoku Cloud analysis projects multiple moving averages forward on the chart and creates a “cloud” of support or resistance levels.

A bearish kumo breakout arises when the price action clearly drops below the Ichimoku Cloud and the future cloud itself shifts in a way that indicates weaker bullish momentum. The core idea is that once an asset’s price slips under the cloud, a further decline becomes more likely, since the cloud that previously acted as support is no longer providing a cushion.

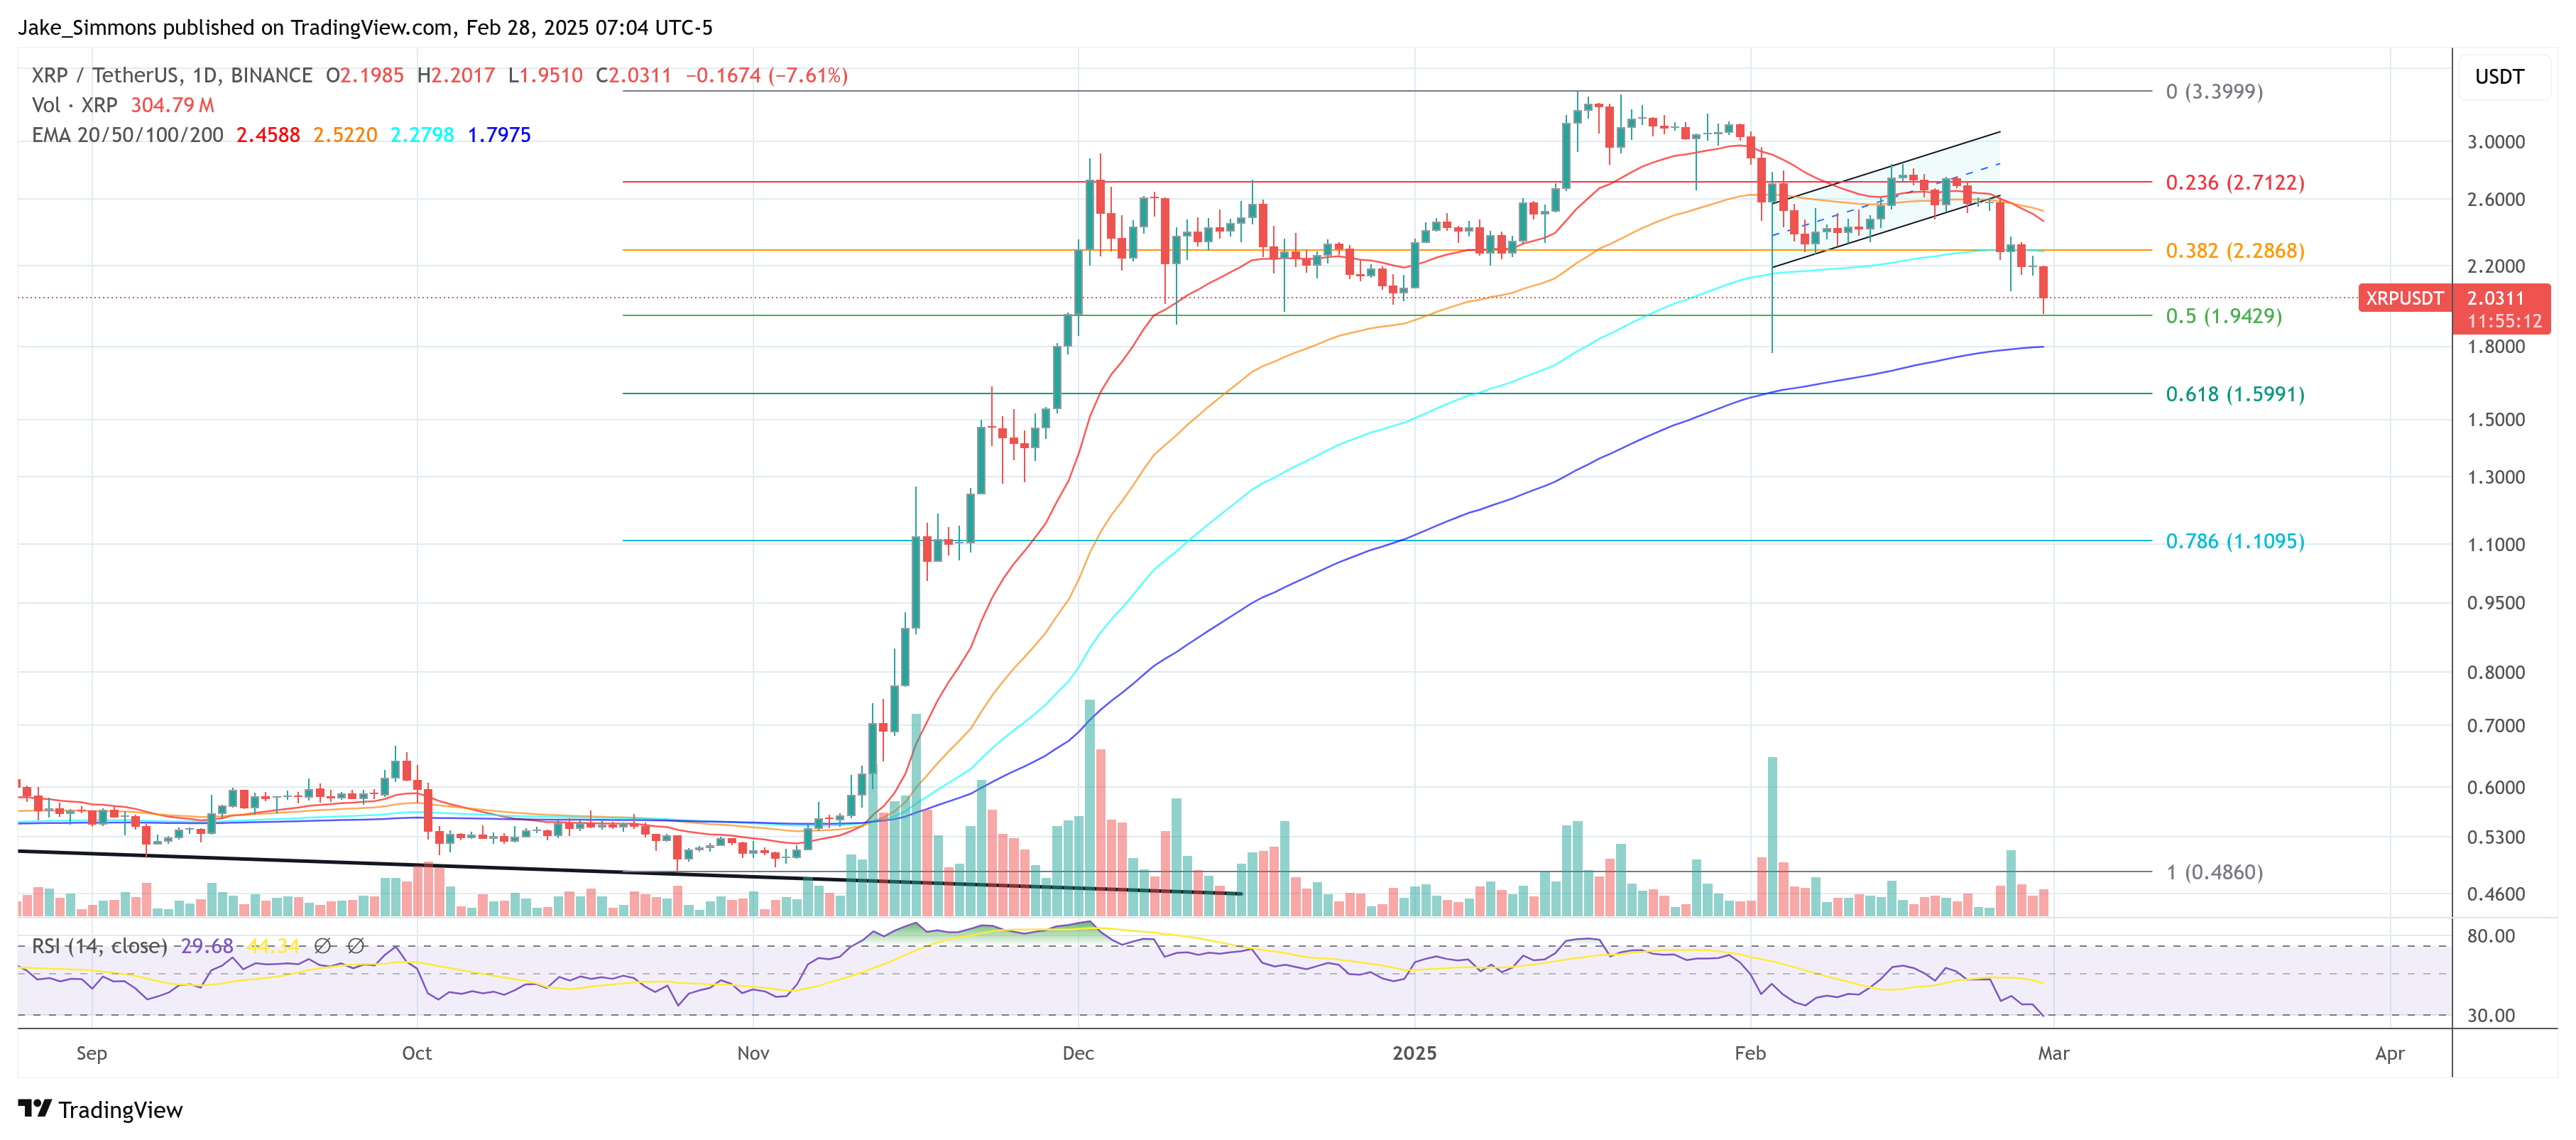
From the chart Olszewicz provided, the current price action around $2.18 sits just above a conspicuous support area in the $2.00 region, which he interprets as the neckline for the Head and Shoulders pattern. If that zone gives way, bears could potentially dominate the market, with Fibonacci levels marked on the chart pointing to a possible first stop near $1.94, followed by an even steeper target.

Related Reading

The chart appears to highlight a 161.8% Fibonacci extension level at around $1.24, which could come into play if selling accelerates. The presence of these Fibonacci levels does not guarantee a breakdown to those lows, but notably, a typical breakdown from the h&s pattern could spell even more doom.

The profit target for the pattern is generally the price difference between the head and the low point of either shoulder. This difference is then subtracted from the neckline which could position the XRP price even below $1.00.

Despite the stark warning about an impending “massive” price crash, it is crucial to note that Olszewicz’s commentary, “1D XRP: H&S + bearish kumo breakout watch,” should be viewed as an alert for traders rather than an irreversible prediction. Technical setups can fail if bullish momentum returns or if broader market fundamentals shift, but for now the entire crypto market seems driven by extreme fear.

At press time, XRP traded at $2.03

XRP price
XRP still holds above $2.0, 1-day chart | Source: XRPUSDT on TradingView.com

Featured image created with DALL.E, chart from TradingView.com

Credit: Source link

ShareTweetSendPinShare
Previous Post

Coinbase Adds Support for DeFi Lending Protocol Altcoin Built on Ethereum and Base

Next Post

AI Data Altcoin Avoids Crypto Market Downtick After Being Added to Coinbase’s Listing Roadmap

Next Post
AI Data Altcoin Avoids Crypto Market Downtick After Being Added to Coinbase’s Listing Roadmap

AI Data Altcoin Avoids Crypto Market Downtick After Being Added to Coinbase’s Listing Roadmap

You might also like

Solana Price Prediction: $1.5 Billion Floods Solana ETFs Despite the Crash — What Do Big Investors See?

Solana Price Prediction: $1.5 Billion Floods Solana ETFs Despite the Crash — What Do Big Investors See?

March 6, 2026
Stablecoin Market Breaks Records — USDC Controls 70% Of $1.8 Trillion Volume

Stablecoin Market Breaks Records — USDC Controls 70% Of $1.8 Trillion Volume

March 7, 2026
Pundit Explains How XRP Becomes A Global Reserve Asset

Pundit Explains How XRP Becomes A Global Reserve Asset

March 3, 2026
Bitcoin Price Prediction: Billion-Dollar Asset Manager Signals Explosive Opportunity After Market Drop

Bitcoin Price Prediction: Billion-Dollar Asset Manager Signals Explosive Opportunity After Market Drop

March 3, 2026
Bitcoin Price Prediction: Veteran Trader Warns Final Flush Is Coming — Is Another Crash Imminent?

Bitcoin Price Prediction: Veteran Trader Warns Final Flush Is Coming — Is Another Crash Imminent?

March 3, 2026
VeChain Foundation Releases Q1 2024 Treasury Report

ElevenLabs Exits Beta With 28-Language AI Voice Model After $11B Valuation

March 6, 2026
CryptoABC.net

This is an Australian online news/education portal that aims to provide the latest crypto news, real-time updates, education and reviews within Australia and around the world. Feel free to get in touch with us!

What's New Here!

Bitcoin Exchange Reserves Fall To 2019 Levels As ETFs And Corporate Treasuries Accumulate

Bitcoin Exchange Reserves Fall To 2019 Levels As ETFs And Corporate Treasuries Accumulate

March 10, 2026
Solana Price Prediction: SOL Just Flipped Ethereum in Critical $600 Billion Metric — Is Solana About to Explode?

Solana Price Prediction: SOL Just Flipped Ethereum in Critical $600 Billion Metric — Is Solana About to Explode?

March 10, 2026

Subscribe Now

  • Contact Us
  • Privacy Policy
  • Terms of Use
  • DMCA

© 2021 cryptoabc.net - All rights reserved!

No Result
View All Result
  • Live Crypto Prices
  • Crypto News
    • Worldwide
      • Bitcoin
      • Ethereum
      • Altcoin
      • Blockchain
      • Regulation
    • Australian Crypto News
  • Education
    • Cryptocurrency For Beginners
    • Where to Buy Cryptocurrency
    • Where to Store Cryptos
    • Cryptocurrency Tax in Australia 2021

© 2021 cryptoabc.net - All rights reserved!

Welcome Back!

Login to your account below

Forgotten Password?

Create New Account!

Fill the forms below to register

All fields are required. Log In

Retrieve your password

Please enter your username or email address to reset your password.

Log In
Please enter CoinGecko Free Api Key to get this plugin works.