• Live Crypto Prices
  • Crypto News
    • Worldwide
      • Bitcoin
      • Ethereum
      • Altcoin
      • Blockchain
      • Regulation
    • Australian Crypto News
  • Education
    • Cryptocurrency For Beginners
    • Where to Buy Cryptocurrency
    • Where to Store Cryptos
    • Cryptocurrency Tax in Australia 2021
No Result
View All Result
CryptoABC.net
No Result
View All Result

Glassnode Points Out Bizarre Consistency In Bitcoin Cycles

January 16, 2023
in Bitcoin
Reading Time: 3min read
0 0
A A
0
Glassnode Points Out Bizarre Consistency In Bitcoin Cycles
0
SHARES
25
VIEWS
ShareShareShareShareShare

Glassnode has pointed out a bizarre consistency between the current and previous Bitcoin cycles in terms of a metric, here’s what.

Bitcoin Breaks Above 200-Day Simple Moving Average Line

A “simple moving average” (SMA) is an analytical tool that produces an average of any given quantity over a specific period of time. As its name already implies, it moves along with the quantity and changes its value accordingly.

SMAs can be quite useful for studying long-term trends, as they smooth out the curve and filter out any short-term fluctuations in the relevant quantity that have no bearing on the longer trends anyways. As is usually the case with tools like these, an SMA can be taken for any length of time, but a few periods like 7 days and 30 days generally find the most use.

According to data from the on-chain analytics firm Glassnode, BTC has spent 381 days under its 200-day SMA curve in this cycle. The 200-day SMA is an important line for BTC as both the bear-to-bull and vice versa transitions have historically taken place with breaks above or below this level.

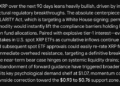
Here is a chart that shows the trend in the 200-day SMA for Bitcoin over the last few years:

The value of the crypto seems to have broken above the 200-day SMA in recent days | Source: Glassnode on Twitter

As displayed in the above graph, the Bitcoin price had dipped below the 200-day SMA around the start of the bear market and had stayed there until very recently. In total, the crypto had spent 381 days below this level, before the latest rally came along and helped the coin finally escape above this line.

In the chart, Glassnode has also highlighted the trend for the metric during the previous bear market. It looks like in that cycle as well, the crypto’s price had declined below the 200-day SMA as the bear began to take hold. Also, the eventual break above the level leads to the end of the bear market for the coin back then.

However, the most interesting of all is the duration that Bitcoin stayed below this level in that cycle: 386 days. Amazingly, this is very nearly the same number of days (381) that BTC took to break above the line in the current cycle.

If this bizarre consistency is anything to go by, then the latest push above the 200-day SMA could mean the current bear market might be done as well.

The chart also shows data for an indicator called the “Mayer Multiple” (MM) which gauges the current distance between the price of Bitcoin and the 200-day SMA. Its value is simply calculated by dividing the value of the crypto by the 200-day SMA. Bottoms in the crypto have usually taken place below the 0.8 MM level, which BTC is now firmly above.

BTC Price

At the time of writing, Bitcoin is trading around $20,800, up 21% in the last week.

Bitcoin Price Chart

BTC consolidates just below $21,000 | Source: BTCUSD On TradingView

Featured image from André François McKenzie on Unsplash.com, charts from TradingView.com, Glassnode.com


Credit: Source link

ShareTweetSendPinShare
Previous Post

Dash 2 Trade Price Pumps 50% to $0.020 As Buyers Snap Up Tokens of Hot Trading Intel Coin

Next Post

Solana Price Pumps to $24

Next Post
Solana Price Pumps to $24

Solana Price Pumps to $24

You might also like

Why Is Crypto Up Today? – October 15, 2025

Strategy Sold Shares and Bought $100 Million Bitcoin: This Is It? Bottom Was 2 Weeks Away?

June 15, 2026

Alchemy AgentCard Brings Visa Payments To AI Agent Commerce

June 18, 2026
Crypto News, June 12: Bitcoin Pump and Dump As Trump Says Iran Peace Deal “Closing” for The 40th time, Clarity Act Heats Up at SpaceX IPO Day

Crypto News, June 12: Bitcoin Pump and Dump As Trump Says Iran Peace Deal “Closing” for The 40th time, Clarity Act Heats Up at SpaceX IPO Day

June 12, 2026
Bitcoin ETFs Snap Outflow Streak While Ether Funds Stay Unde

Bitcoin ETFs Snap Outflow Streak While Ether Funds Stay Unde

June 15, 2026
Crypto Markets Slip as Fed Holds Rates Steady, Signals Hawkish Outlook

Crypto Markets Slip as Fed Holds Rates Steady, Signals Hawkish Outlook

June 18, 2026
UK FCA Clears Binance, Saying Exchange Has Complied with its Demands

Binance Builds Multi-Asset Super App, Expands Into Equities

June 12, 2026
CryptoABC.net

This is an Australian online news/education portal that aims to provide the latest crypto news, real-time updates, education and reviews within Australia and around the world. Feel free to get in touch with us!

What's New Here!

Google’s Gemini AI Predicts Incredible XRP Price For Next 90 Days

Google’s Gemini AI Predicts Incredible XRP Price For Next 90 Days

June 18, 2026

Alchemy AgentCard Brings Visa Payments To AI Agent Commerce

June 18, 2026

Subscribe Now

  • Contact Us
  • Privacy Policy
  • Terms of Use
  • DMCA

© 2021 cryptoabc.net - All rights reserved!

No Result
View All Result
  • Live Crypto Prices
  • Crypto News
    • Worldwide
      • Bitcoin
      • Ethereum
      • Altcoin
      • Blockchain
      • Regulation
    • Australian Crypto News
  • Education
    • Cryptocurrency For Beginners
    • Where to Buy Cryptocurrency
    • Where to Store Cryptos
    • Cryptocurrency Tax in Australia 2021

© 2021 cryptoabc.net - All rights reserved!

Welcome Back!

Login to your account below

Forgotten Password?

Create New Account!

Fill the forms below to register

All fields are required. Log In

Retrieve your password

Please enter your username or email address to reset your password.

Log In
Please enter CoinGecko Free Api Key to get this plugin works.