


Este artículo también está disponible en español.
In a note published on Tuesday, Jurrien Timmer, Director of Global Macro at Fidelity Investments, discusses how a shifting economic landscape could influence markets, central bank policy, and the trajectory of both Bitcoin and gold. With the S&P 500 hitting new highs and the so-called “Trump Trade” reversing course, Timmer offers nuanced insights into fiscal policy, inflation, and the role of risk assets in a “limbo” market environment.
The Trump Effect
Timmer observes that the first six weeks of 2025 have brought unexpected market moves and an unusually high “noise-to-signal ratio.” The dominant market expectation coming into the year—anticipating “higher yields, a stronger dollar, and outperforming US equities”—has abruptly flipped. He notes: “It seems so 2025 that the consensus trade of higher yields, a stronger dollar, and outperforming US equities has turned into the opposite.”
Timmer highlights that Bitcoin, fresh off a year-end rally, remains on top of rolling three-month return rankings, followed closely by gold, Chinese equities, commodities, and European markets. At the lower end of the table, the US dollar and Treasuries are bringing up the rear.
Related Reading
Despite the S&P 500’s record levels, Timmer calls this a “digestion period” following the post-election optimism. He explains that the market beneath the headline index is much less decisive. According to Timmer, the equal-weighted index remains on hold, with only 55% of stocks trading above their 50-day moving averages.
“Sentiment is bullish, credit spreads are narrow, the equity risk premium (ERP) is in the 10th decile, and the VIX is at 15. The market appears to be priced for success.” Timmer underscores that while earnings growth was robust at 11% in 2024, revisions appear lackluster, and there are open questions about what might happen if long-term rates climb towards 5% or beyond.
One of the most critical pieces of Timmer’s analysis centers on Federal Reserve policy. He points to the recent CPI report, with a year-over-year core inflation figure of 3.5%, as a near-consensus indicator that the Fed will remain on pause. “It’s now all but unanimous that the Fed is on hold for some time to come. That’s exactly right, in my view. If neutral is 4%, I believe the Fed should be a smidge above that level, given the potential likelihood that ‘3 is the new 2.’”
He warns about the possibility of a “premature pivot,” recalling the policy mistakes from the 1966–1968 period, when rate cuts happened too early, ultimately allowing inflation to gain a foothold.
With the Fed apparently sidelined, Timmer believes the next market driver for interest rates will come from the long end of the curve. Specifically, he sees tension between two scenarios: one featuring endless deficit spending and rising term premiums—hitting equity valuations—and another emphasizing fiscal discipline, which would presumably rein in long-dated bond yields.
Timmer also remarks that weekly jobless claims may come into sharper focus for bond markets, given how government spending under the new administration could influence employment data.
Related Reading
Timmer points out a potential bullish pattern—a head-and-shoulders bottom—in the Bloomberg Commodity Spot Index. Though he stops short of calling it a definitive shift, he notes that commodities remain in a broader secular uptrend and could see renewed investor interest if inflation pressures stay elevated or fiscal conditions remain loose.
Gold, he notes, has been “a big winner” in recent years, outperforming many skeptics’ expectations: “Since 2020, gold has produced almost the same return as the S&P 500 while having a lower volatility. In my view, gold remains an essential component of a diversified portfolio in a regime in which bonds might remain impaired.”
Timmer sees gold testing the critical $3,000 level amid a global uptick in money supply and a decline in real yields. Historically, gold has shown a strong negative correlation with real yields, though Timmer believes the metal’s strength of late may also reflect fiscal rather than monetary dynamics—particularly, geopolitical demand from central banks in China and Russia.
Bitcoin Vs. Gold
According to Timmer, the outperformance of both gold and Bitcoin has “sparked a lot of conversation about monetary inflation.” However, he draws a distinction between the “quantity of money” (the money supply) and the “price of money” (price inflation).
“The point of this exercise is to show that the growth in traditional asset prices over time can’t just be explained away by monetary debasement (which is a favorite pastime of some bitcoiners),” he writes.
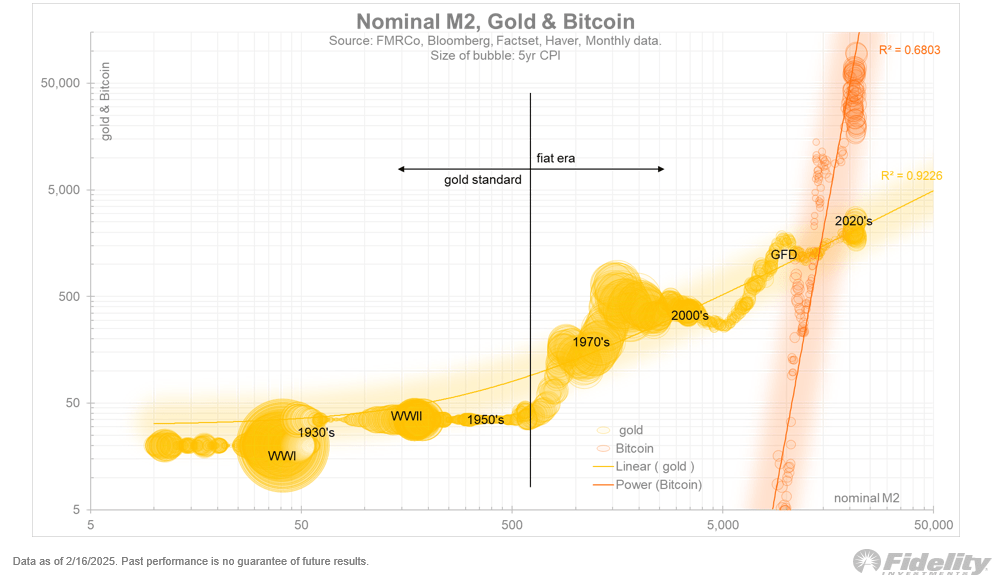
Timmer’s charts suggest that while nominal M2 and nominal GDP have moved in near lockstep for over a century, consumer price inflation (CPI) has lagged somewhat behind money supply growth. He cautions that adjusting asset prices solely against M2 may produce misleading conclusions.
Still, his analysis finds that both Bitcoin and gold have strong correlations to M2, albeit in different ways: “It’s interesting that there’s a linear correlation between M2 and gold, but a power curve between M2 and Bitcoin. Different players on the same team.”
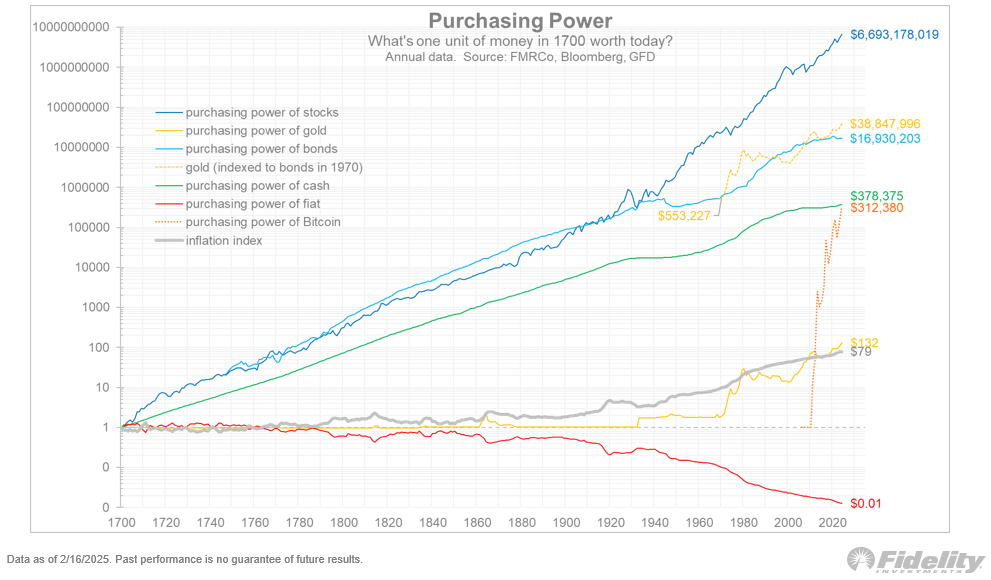
Timmer highlights gold’s long-run performance since 1970, noting that it has effectively kept pace—or even exceeded—the value created by many bond portfolios. He sees gold’s role as a “hedge against bonds,” especially if sovereign debt markets remain pressured by fiscal deficits and higher long-term rates.
Timmer’s note underscores that Bitcoin’s strong performance cannot be seen in isolation from gold or the broader macroeconomic environment. With yields in flux and policymakers grappling with deficits, investors may be forced to reassess the traditional 60/40 portfolio model.
He emphasizes that while past expansions of the money supply have often spurred inflation, the relationship is not always one-to-one. Bitcoin’s meteoric rise could, in Timmer’s view, reflect a market perception that fiscal concerns—not just monetary policy—are driving asset prices. “And as you can see from the dotted orange line and the green line, Bitcoin has added the same amount of value that overnight money took over 300 years to create,” he concluded.
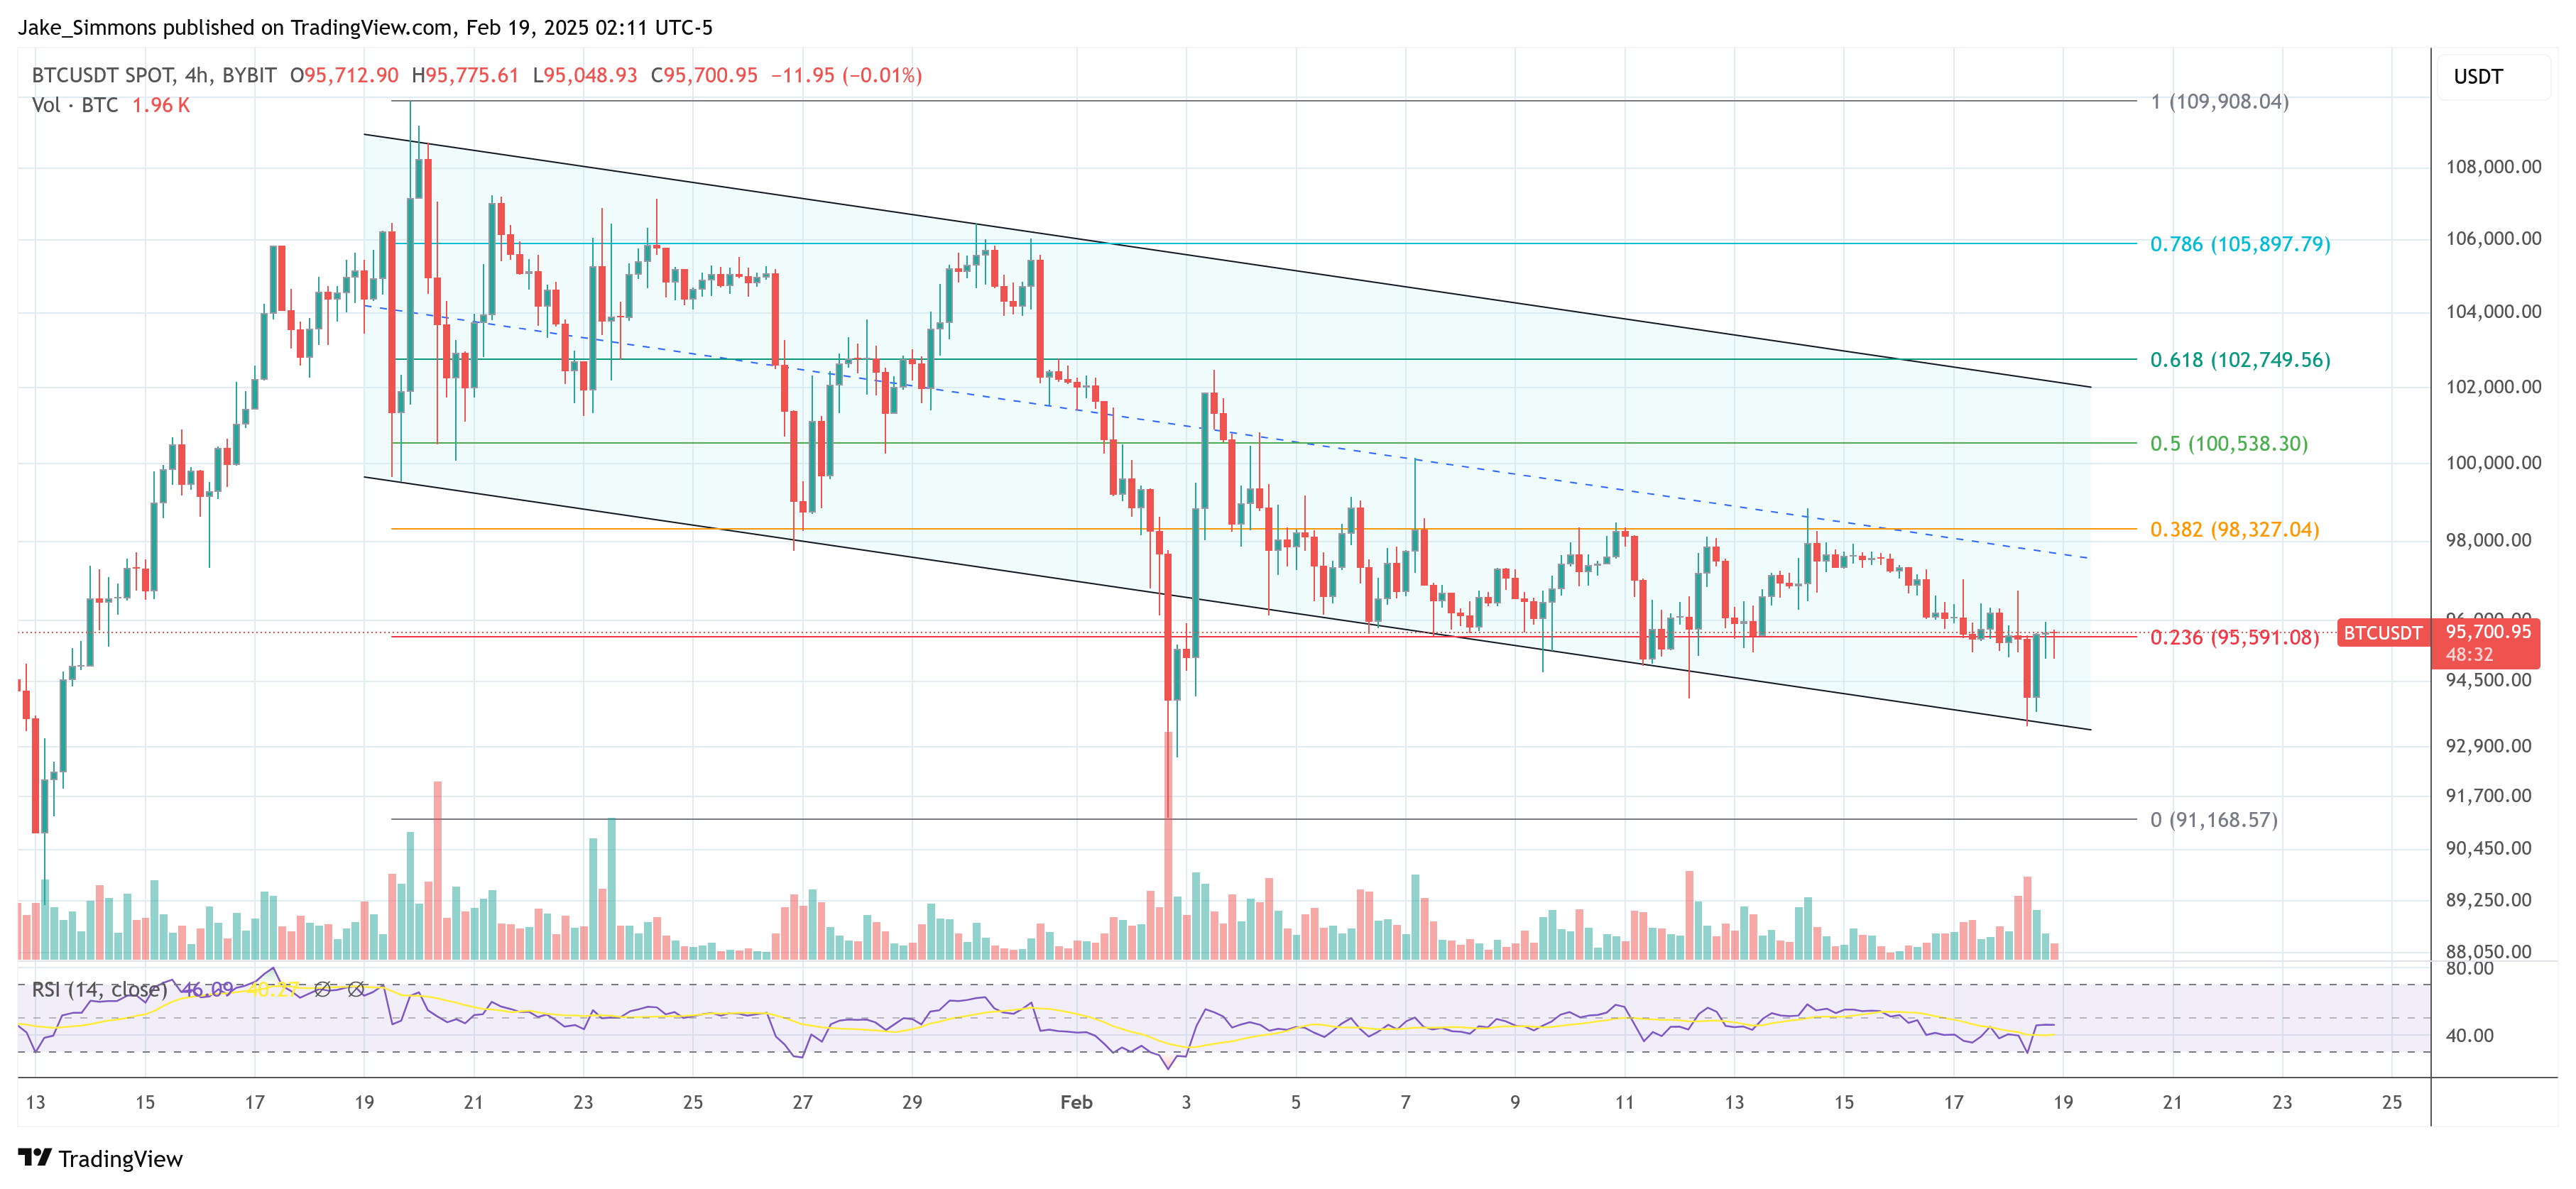
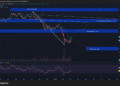
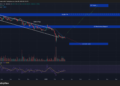
At press time, BTC traded at $95,700.
Featured image from YouTube, chart from TradingView.com
Credit: Source link


