


Felix Pinkston
Sep 14, 2025 13:33
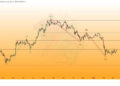
ETHFI price trades at $1.48 with strong bullish momentum as technical indicators show the token near resistance at $1.61. Ether.Fi RSI at 64.79 signals continued upward potential.
Quick Take
• ETHFI currently trading at $1.48 (-0.20% in 24h)
• Ether.Fi’s RSI at 64.79 indicates neutral momentum with room for further upside
• Strong bullish trend confirmed with price trading 54% above 200-day moving average
What’s Driving Ether.Fi Price Today?
Despite the modest 0.20% decline in the past 24 hours, ETHFI price action remains fundamentally strong within a broader bullish context. The current trading range between $1.43 and $1.61 reflects healthy consolidation after significant gains, with the token maintaining its position well above key moving averages.
The absence of major news catalysts in recent days has shifted focus to technical factors, where Ether.Fi demonstrates impressive strength. Trading volume of $43.2 million on Binance spot market indicates sustained institutional and retail interest despite the temporary pullback.
Market participants appear to be digesting recent gains while positioning for the next potential breakout above the $1.61 resistance level that has capped recent advances.
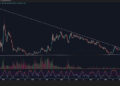
ETHFI Technical Analysis: Bullish Signals Emerge
Ether.Fi technical analysis reveals a compelling bullish setup across multiple timeframes. The most significant indicator is ETHFI’s position relative to its moving averages, trading at $1.48 compared to the 200-day SMA at $0.96 – a remarkable 54% premium that underscores the token’s fundamental strength.
ETHFI RSI at 64.79 sits comfortably in neutral territory, providing room for additional upward movement before reaching overbought conditions. This positioning is particularly encouraging for traders seeking entry points, as it suggests the recent rally hasn’t exhausted buying momentum.
The MACD configuration presents another bullish signal for Ether.Fi, with the histogram at 0.0436 indicating strengthening momentum. The MACD line at 0.0867 trading above its signal line at 0.0431 confirms the uptrend remains intact despite today’s minor pullback.
Ether.Fi’s Bollinger Bands analysis shows the token at 93.40% of the band width, positioned near the upper resistance at $1.52. This elevated position typically signals either a breakout attempt or short-term consolidation before the next move.
Ether.Fi Price Levels: Key Support and Resistance
Critical ETHFI resistance emerges at $1.61, representing both the 24-hour high and immediate technical ceiling. A decisive break above this level could trigger momentum-driven buying toward the 52-week high of $2.40, representing potential upside of 62% from current levels.
Ether.Fi support levels provide multiple safety nets for current holders. Immediate support sits at $1.00, aligning with psychological round numbers that often attract buying interest. Stronger support emerges at $0.90, coinciding with the lower Bollinger Band and representing a 39% downside buffer.
The pivot point at $1.51 serves as a key decision level for ETHFI/USDT traders. Sustained trading above this level favors continued bullish momentum, while a break below could signal short-term consolidation toward the $1.00 support zone.
Should You Buy ETHFI Now? Risk-Reward Analysis
Based on Binance spot market data, ETHFI price presents an intriguing risk-reward proposition for different trader profiles. Aggressive traders might consider positions targeting the $1.61 resistance break, with stops below $1.43 offering a favorable 3:1 risk-reward ratio toward $2.00 targets.
Conservative investors may prefer waiting for a pullback toward Ether.Fi support levels around $1.00-$1.20, where the convergence of multiple moving averages provides stronger technical foundation. This approach offers better entry prices while maintaining exposure to the overall bullish trend.
Swing traders should monitor ETHFI RSI closely, as readings above 70 could signal short-term overbought conditions requiring patience. The current 64.79 reading suggests optimal timing for position building ahead of potential momentum acceleration.
Risk management remains crucial given Ether.Fi’s ATR of $0.11, indicating significant daily volatility that can create both opportunities and challenges for position sizing.
Conclusion
ETHFI price action suggests continued bullish momentum despite today’s minor pullback, with technical indicators supporting further upside potential. The key catalyst will be Ether.Fi’s ability to break above $1.61 resistance, which could unlock rapid movement toward previous highs. Traders should monitor volume patterns and RSI development over the next 24-48 hours for confirmation of the next directional move in ETHFI/USDT.
Image source: Shutterstock
Credit: Source link


