


Reason to trust
Strict editorial policy that focuses on accuracy, relevance, and impartiality
Created by industry experts and meticulously reviewed
The highest standards in reporting and publishing
Strict editorial policy that focuses on accuracy, relevance, and impartiality
Morbi pretium leo et nisl aliquam mollis. Quisque arcu lorem, ultricies quis pellentesque nec, ullamcorper eu odio.
Este artículo también está disponible en español.
According to a recent X post by crypto analyst Ali Martinez, Ethereum (ETH) is inching closer to a critical demand zone that has historically marked market bottoms. Notably, ETH has declined by more than 21% over the past two weeks.
Ethereum About To See Trend Reversal?
Ethereum may soon witness a relief rally, as the second-largest cryptocurrency by market cap nears a key demand zone that has historically marked market bottoms and offered strong buying opportunities.
Related Reading
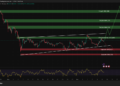
Sharing his analysis, Martinez posted the following chart, illustrating how ETH is likely approaching the -1 standard deviation pricing band based on Market Value to Realized Value (MVRV) Extreme Deviation Pricing Bands.
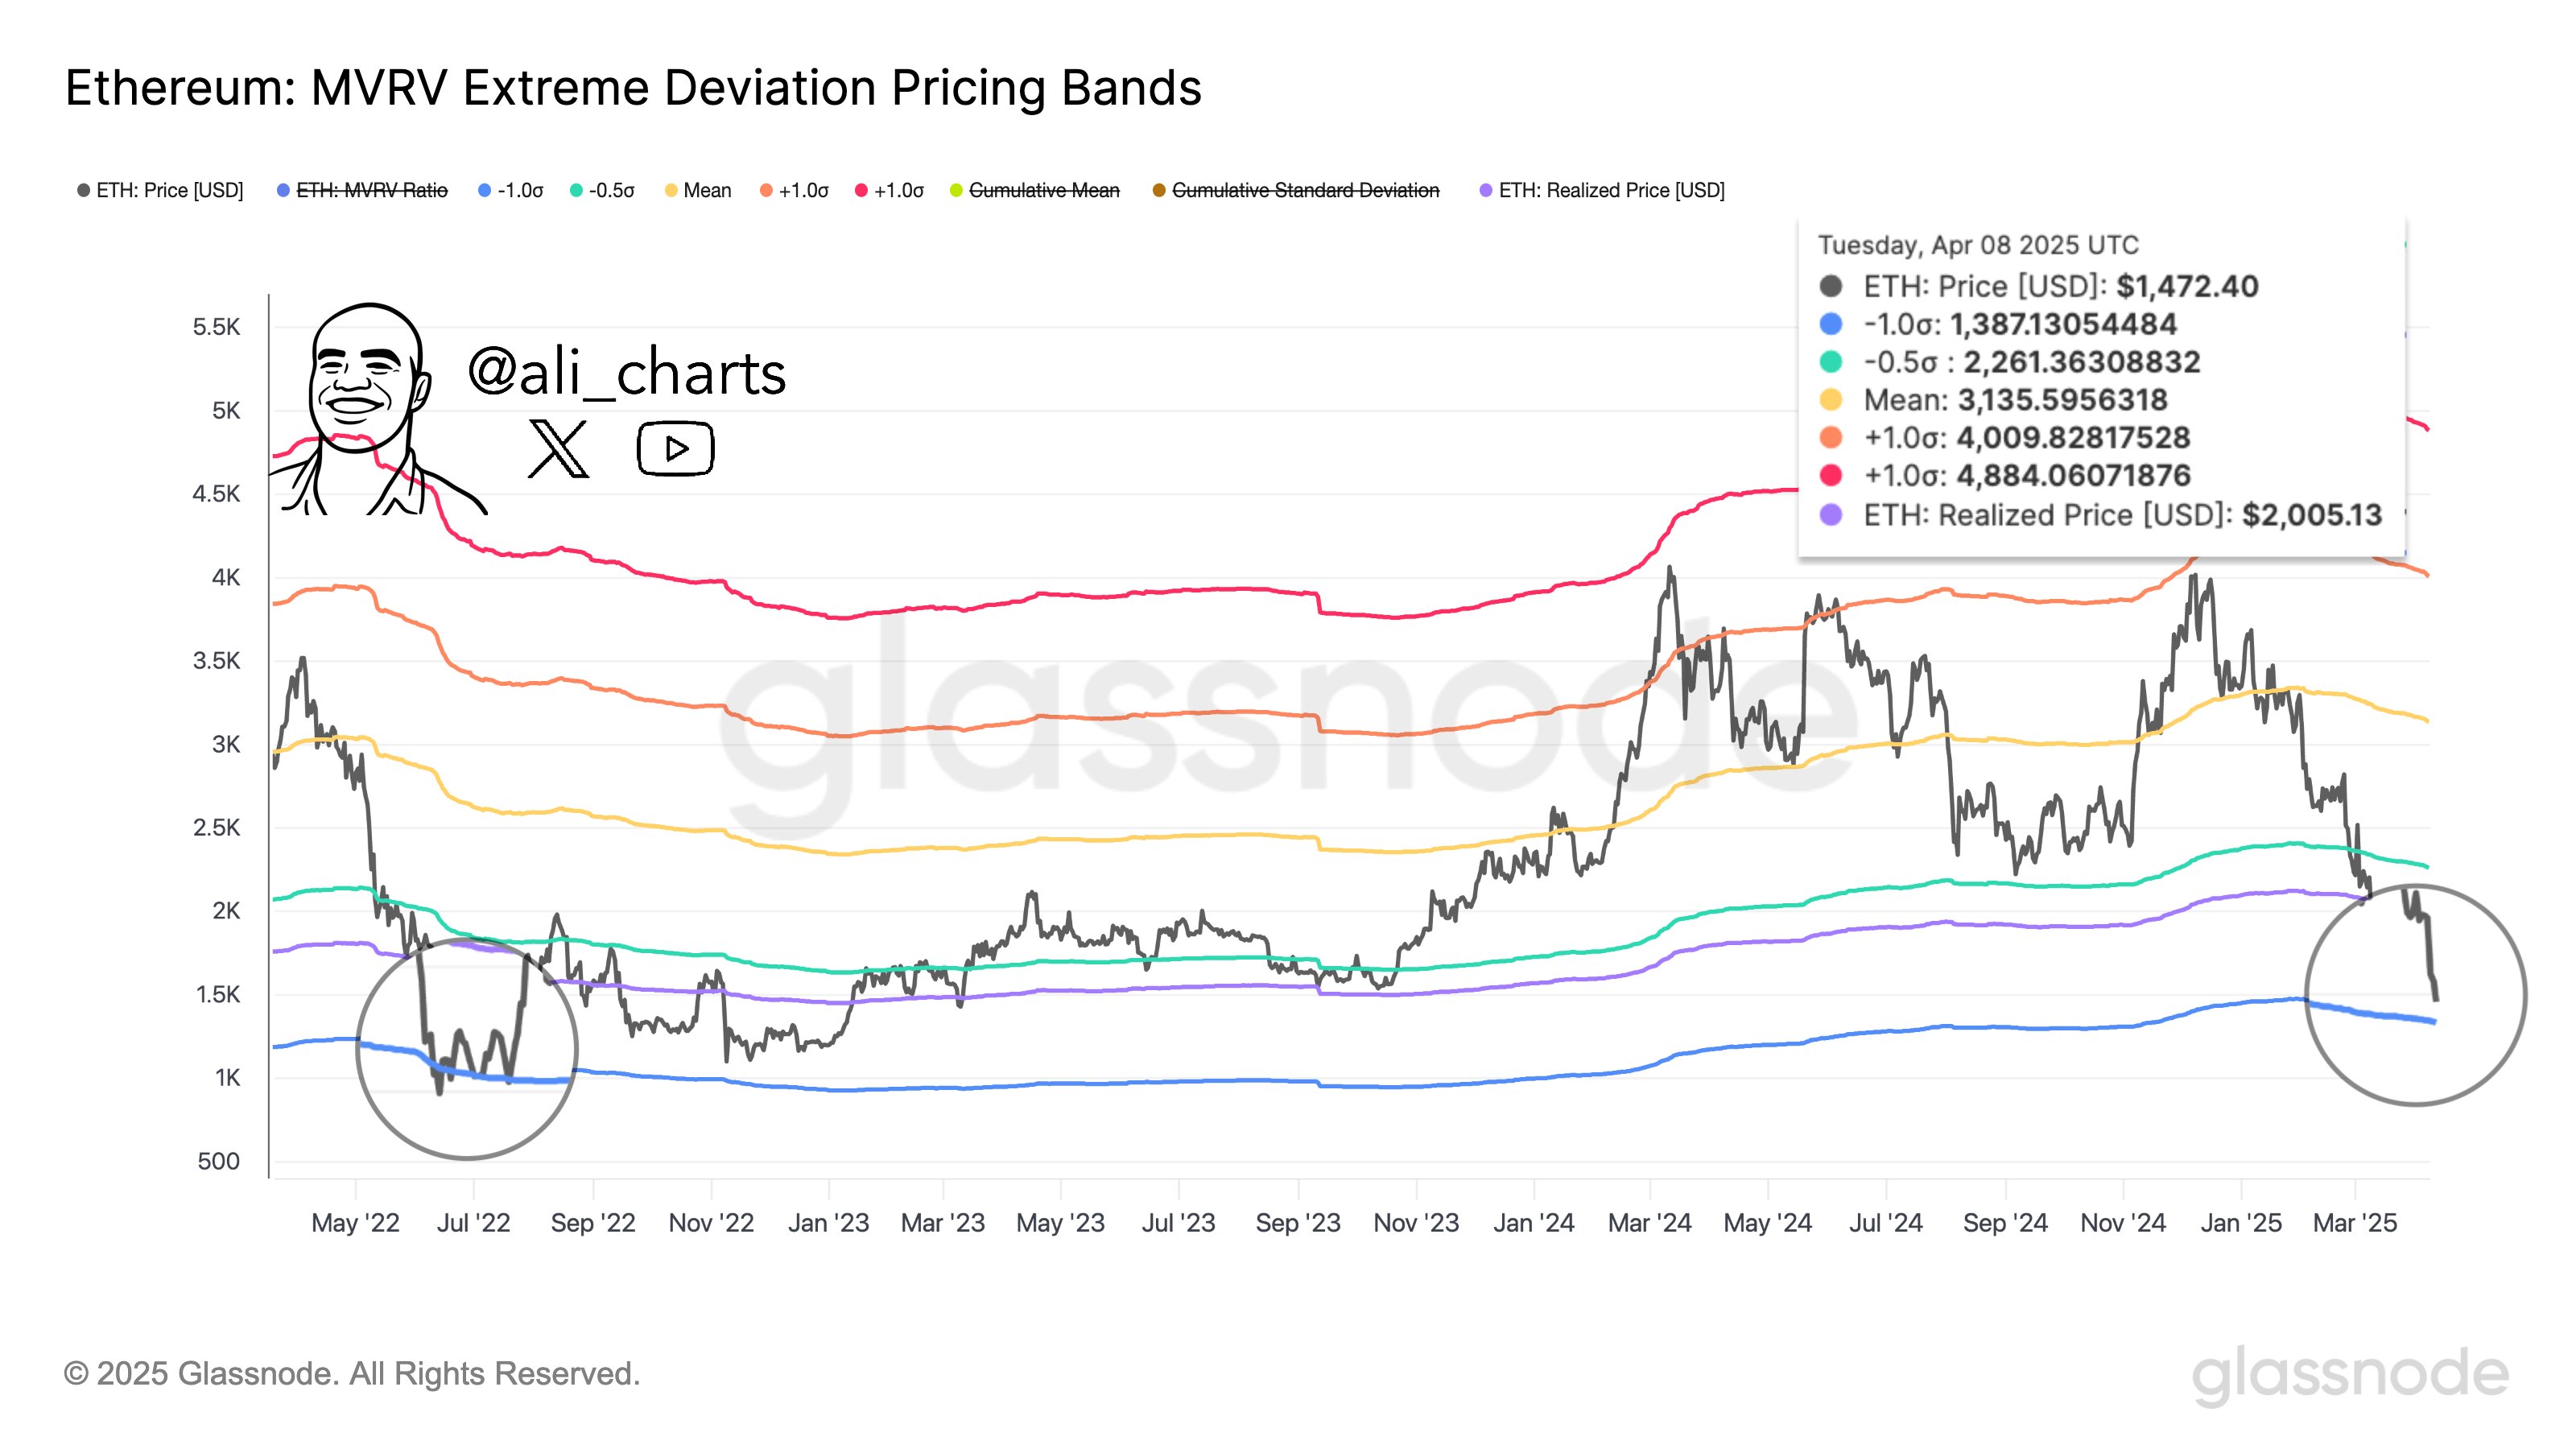
According to the chart, the -1 standard deviation pricing band lies around $1,387, while ETH’s realized price hovers around $2,005. The last time ETH touched this band – back in July 2022 – it marked a local market bottom.
For the uninitiated, MVRV Extreme Deviation Pricing Bands are on-chain metrics that help identify potential market tops or bottoms by measuring how far ETH’s current market value deviates from its realized value. These bands highlight historically significant overvalued or undervalued zones, often aligning with periods of extreme investor sentiment or price reversals.
As ETH nears the -1 standard deviation pricing band, it suggests the asset may be significantly undervalued at its current price. Fellow crypto analyst TraderPA appears to support Martinez’s view.
In an X post, TraderPA shared a weekly Ethereum chart showing that ETH’s price decline aligns with a low Stochastic Relative Strength Index (RSI) value – indicating the cryptocurrency may be oversold following the recent sell-off.
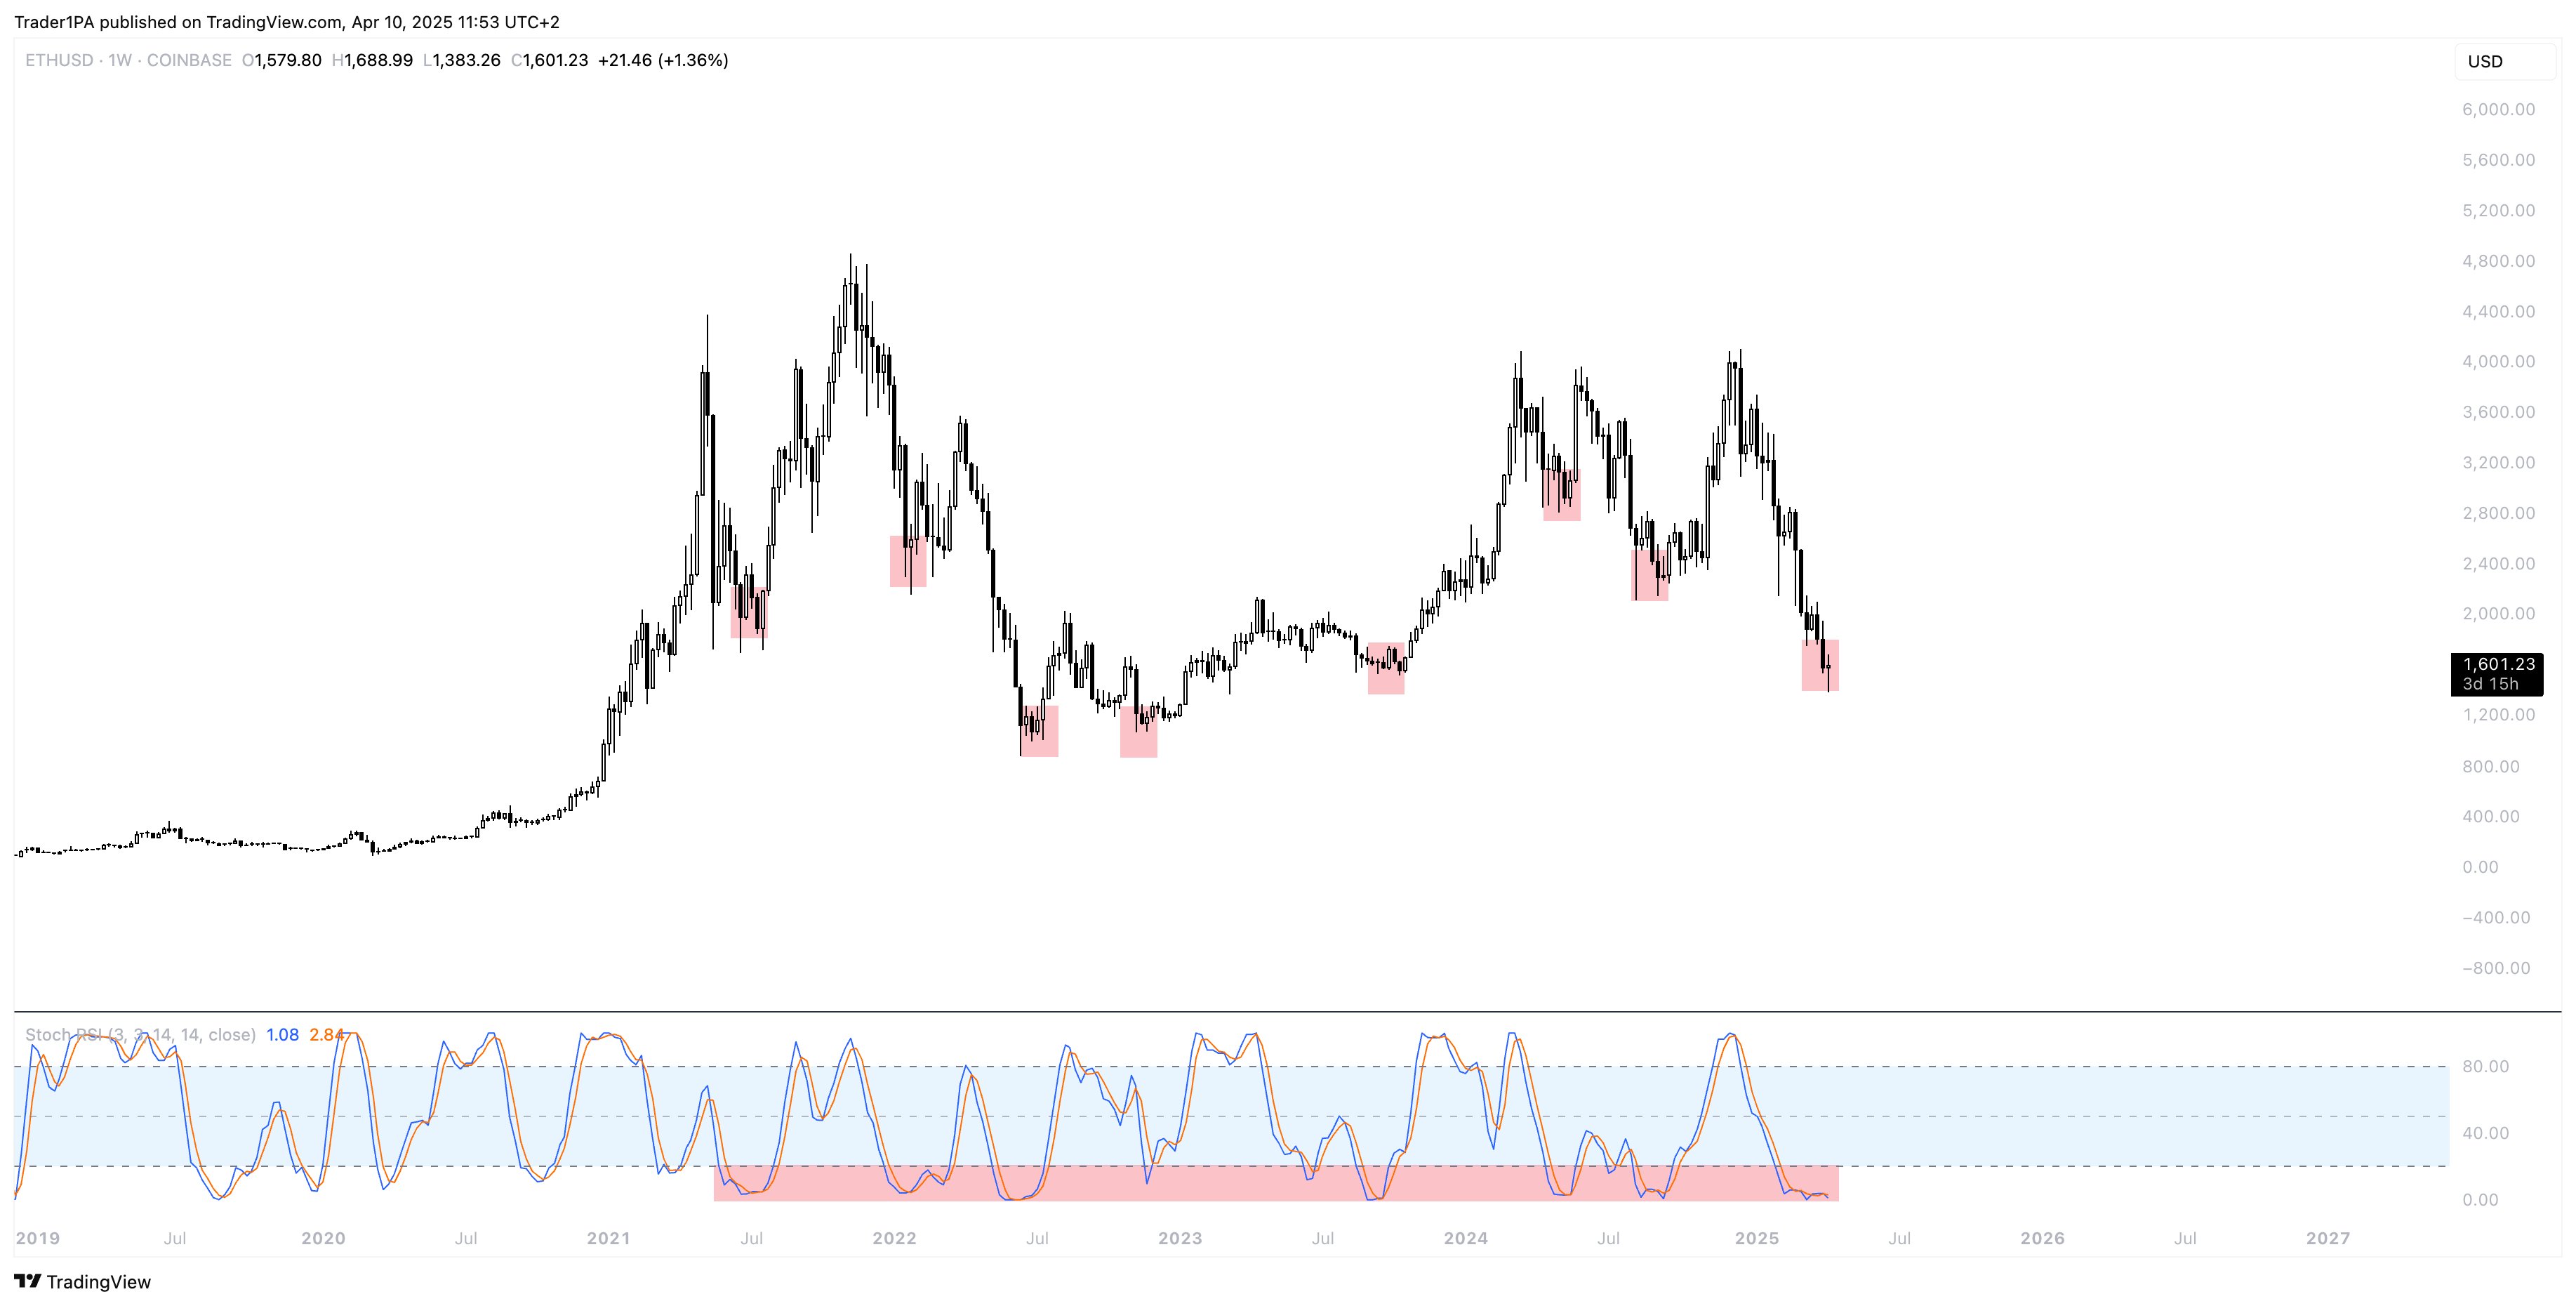
The Stochastic RSI is a momentum indicator that applies the stochastic oscillator formula to RSI values rather than price, making it more sensitive and responsive to short-term movements. Unlike the standard RSI – which ranges from 0 to 100 – the Stochastic RSI ranges between 0 and 1, helping traders identify overbought or oversold conditions.
Whales Losing Confidence In ETH
While Martinez and TraderPA’s analyses suggest ETH may be undervalued, recent whale activity points to a possible loss of confidence. A previously dormant ETH whale dumped 10,702 ETH after nearly two years of inactivity, signaling weakening conviction among large investors.
Related Reading
Interestingly, the whale had originally received ETH back in 2016, when it was valued at just $8. Despite holding through the 2021 peak near $4,000, the recent price drop seems to have triggered a significant sell-off.
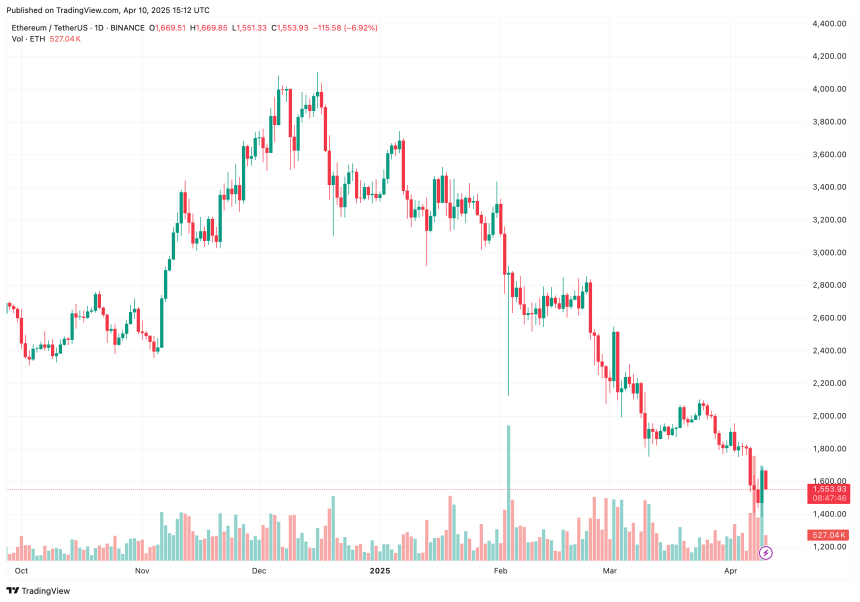
Additionally, Martinez’s latest analysis suggests that ETH could drop to $1,200, as the asset continues to break below multiple key support levels. At press time, ETH trades at $1,553, up 5.5% in the past 24 hours.
Featured image from Unsplash, charts from X and TradingView.com
Credit: Source link


