Reason to trust
![]()
Strict editorial policy that focuses on accuracy, relevance, and impartiality
Created by industry experts and meticulously reviewed
The highest standards in reporting and publishing
Strict editorial policy that focuses on accuracy, relevance, and impartiality
Morbi pretium leo et nisl aliquam mollis. Quisque arcu lorem, ultricies quis pellentesque nec, ullamcorper eu odio.
Ethereum is approaching a decisive phase that could carry it into five-figure territory, according to a multi-timeframe analysis from trader Cantonese Cat (@Cantonmeow).
Ethereum Ready To Smash All-Time Highs
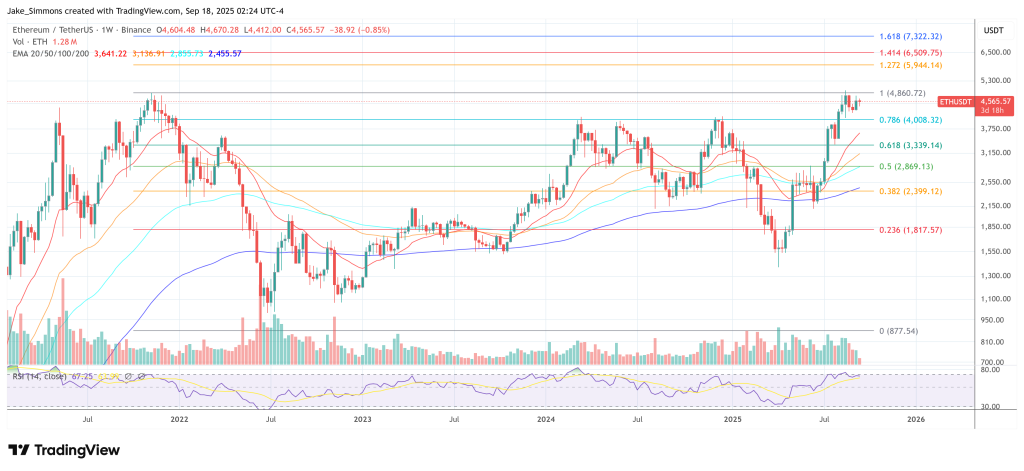
In a video published today, the analyst argues that ETH has cleared a cluster of late-cycle resistances and is now exhibiting a confluence of technical signals—on monthly, weekly, daily, and intraday charts—that “favor some of the higher targets to be met, maybe 1.272, 1.414, 1.618, anywhere around potentially five figures.” These Fib levels would put ETH at $7,752, $9,883 and $14,011 respectively.
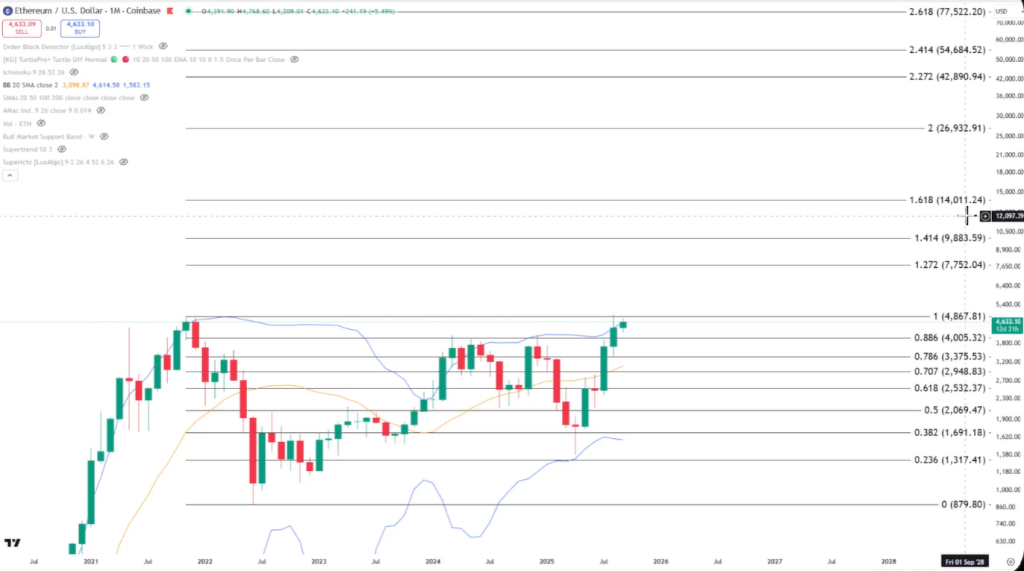
On the monthly chart, the analyst centers his case on the log-scale Fibonacci structure and volatility regime. ETH, he says, spent months stalling around the 0.886 retracement near $4,000—the same zone that repeatedly repelled the market in prior attempts—but “last month, we had the break through that here, convincingly.”
Related Reading
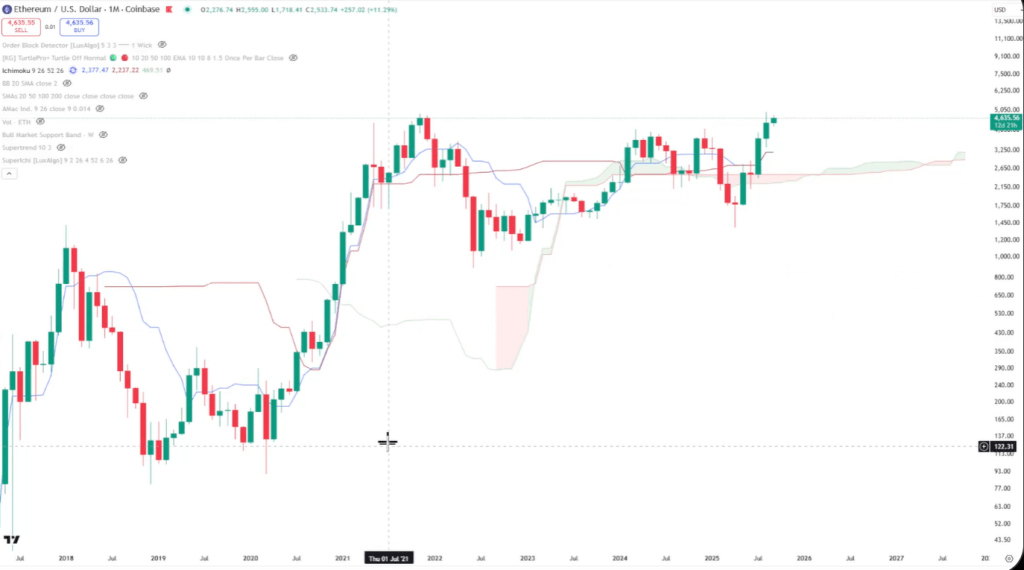
He notes that the wick of the latest push already poked above the wick from the November 2021 peak, reinforcing the idea that supply at the former top is thinning. Simultaneously, the monthly Bollinger Bands are expanding while price “is impulsively going to the upside here along with the upper Bollinger Band,” a backdrop he describes as consistent with trend acceleration rather than mean reversion. “It does favor some of the higher targets to be met,” he said, while stressing sequencing: “We need to kind of break above the previous all-time high here first before we can actually talk about moving further up.”
A second pillar of the bullish thesis is the Ichimoku profile across cycles—specifically the fusion of Tenkan-sen (conversion line) and Kijun-sen (base line). “When you have the Tenkan and Kijin fused together and price is riding up along with it, this fusion over here is called Katana,” he explained. Historically, he said, this “precipitates a big move,” and with price now above the Katana, “the Katana is shooting the price up.” On the current structure: “We got a Katana here being built up and price is currently impulsively going to the upside, so that is also favorable for Ethereum.”
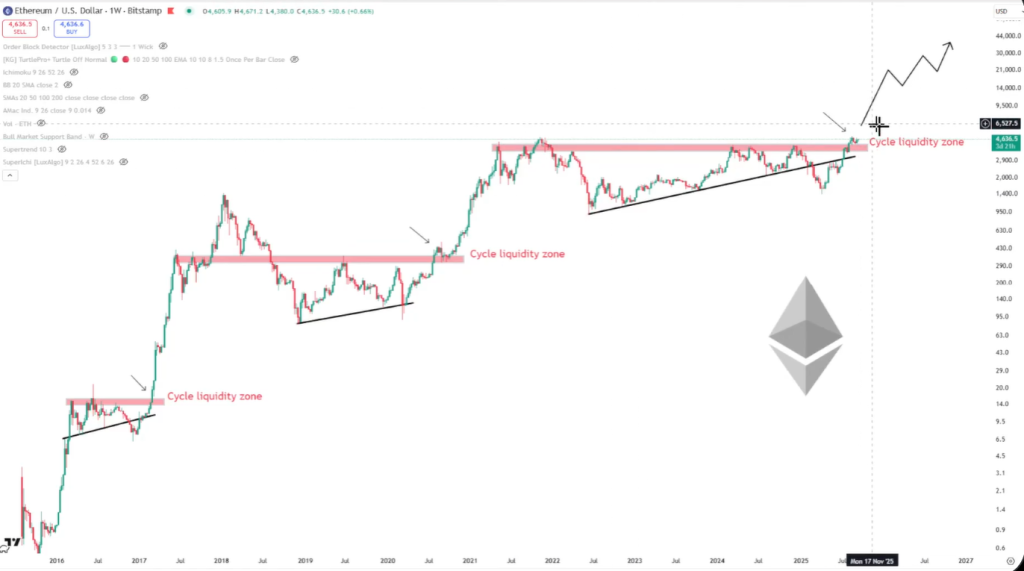
On the weekly timeframe, Cantonese Cat frames ETH’s advance through a three-cycle template defined by a “cycle liquidity zone” acting as a pivot. Each prior cycle saw deviations above and below a governing trend line before a sustained move once the zone was recaptured. He places the present consolidation directly on that blueprint: after breaking the “$4,000 liquidity level,” ETH is “consoling sideways… trying to find some energy before breaking up higher.” A back-test is possible but not required, he said; the “primary case” remains continuation unless the chart invalidates.
Lower Timeframe Signals
The lower timeframes, in his view, are already aligning with that outcome. On the daily chart, he highlights a developing “Adam and Eve continuation pattern” nested within a classic cup-and-handle, where “the handle… volume is not that great,” which he views as textbook, followed by “a pretty decent volume bullish engulfing candle.”
Measured against log-scale retracements, price was rejected at 0.786, found support at 0.5, and is now “trying to break through 0.6… work our way back… to 0.786,” a rhythm he says “is being respected pretty decently.” He also points to a short-term bottoming sequence—“you can see something called a tweezer bottom… if you have anywhere around two or three of these kind of wick sticking down like that, that’s usually a pretty decent bottom”—and a three-candle “morning star” reversal: “It’s a reversal pattern and it could end up leading to a reversal here… seems to be working out pretty well.”
Related Reading
On the 12-hour chart, he reads the structure as reaccumulation in a Wyckoff sense, referencing the “rounded bottom,” a strengthening secondary test—“the ST is higher than the VCLX”—and the emergence of a “creek” overhead that price appears ready to vault. “It does look like a reaccumulation type pattern… showing some strength… consolidating sideways… to reaccumulate before [a] bullish continuation,” he said, adding that after the prior vertical leg, digestion at elevated levels is constructive.
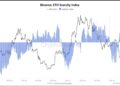
Relative-strength diagnostics, he argues, reinforce the ETH-led narrative. Ethereum’s market-share gauge (ETH.D) “has broken above the Ichimoku cloud… with strength,” then “back-tested the cloud for about four weeks,” and may be waiting for the Tenkan to “rise… as support” before the next leg. On a monthly volatility basis, he adds, “the 20-month moving average was reclaimed… and we simply spent a month here back-testing” it—evidence that dominance could trend higher if the back-test holds. “That’s basically meaning that Ethereum wants to continue to outperform the rest of the cryptocurrency market here for [the] foreseeable future,” he said.
Breadth indicators outside of ETH also tilt risk-on in his framework. The Total3 index (total crypto market cap excluding Bitcoin and Ethereum) is “trying to break above and form an all-time high” on a monthly “cup and handle” structure, while the “Others” index (market cap excluding the top 10 coins) has punched through the 0.786 level on the weekly and is “gravitat[ing]… to the next level, the 0.886.”
He emphasizes the distinction between log and linear retracements, noting a failed linear 0.886 breakout in a prior attempt: “If we were to break above the linear, as well as the log 0.886 here with style, then I think Others would end up performing extremely well and would end up following the footsteps of Ethereum.” His conclusion is unambiguous: “I am bullish on Ethereum. I’m bullish on altcoin. I’m bullish on the cryptocurrency market space in general.”
At press time, ETH traded at $4,565.
Featured image created with DALL.E, chart from TradingView.com
Credit: Source link