


Reason to trust
Strict editorial policy that focuses on accuracy, relevance, and impartiality
Created by industry experts and meticulously reviewed
The highest standards in reporting and publishing
Strict editorial policy that focuses on accuracy, relevance, and impartiality
Morbi pretium leo et nisl aliquam mollis. Quisque arcu lorem, ultricies quis pellentesque nec, ullamcorper eu odio.
Este artículo también está disponible en español.
Ethereum has been holding steady above the $1,800 level despite multiple failed attempts to break higher. The current price action signals a potential shift, with volatility compressing and momentum building for a major move in either direction. After months of selling pressure and weak performance relative to Bitcoin, analysts now believe ETH is approaching a critical inflection point.
Related Reading
Top analyst Ted Pillows shared a key technical observation, highlighting the formation of a long-legged Doji candle on Ethereum’s monthly timeframe. This type of candle typically reflects intense market indecision, where both bulls and bears tested the extremes, but neither side gained clear control by the close. It’s often seen near major turning points, especially after prolonged downtrends or consolidations.
If Ethereum can reclaim the $2,000 level in the coming sessions, it would confirm bullish intent and open the door to a stronger rally. On the other hand, failure to hold above $1,750 could trigger renewed downside pressure, possibly retesting deeper support zones.
For now, ETH remains trapped in a tight range, but the technical setup and market structure suggest that a decisive breakout could soon define Ethereum’s path for the weeks ahead.
Ethereum Key Resistance Levels Limit Upside
Ethereum has been trading below the $2,000 level since late March, and this prolonged consolidation signals a market still searching for direction. Despite bouncing from local lows, ETH remains over 55% down from its December highs, reflecting the broader weakness in the altcoin market. Bulls have managed to hold the $1,800 level, but a sustained breakout above supply-heavy zones like $2,000–$2,100 is required to confirm any meaningful reversal.
In the short term, Ethereum has started to build a more bullish structure, with higher lows forming across intraday charts. This suggests that bulls are gradually reclaiming control, though the pressure from sellers remains strong. Volume continues to thin out during upward moves, and without a decisive breakout, price may continue to chop sideways or revisit lower support zones near $1,700 or $1,550.
Market sentiment is cautiously optimistic, with analysts closely watching technical signals for confirmation. Pillows pointed out that ETH recently formed a long-legged Doji candle on the monthly chart—a rare formation that often signals market indecision or the beginning of a trend reversal.

If this candle marks a turning point, Ethereum may be preparing for a breakout. However, until bulls reclaim key resistance, the risk of a move into lower demand zones remains very real.
Related Reading
ETH Price Consolidates as Bulls Eye Breakout
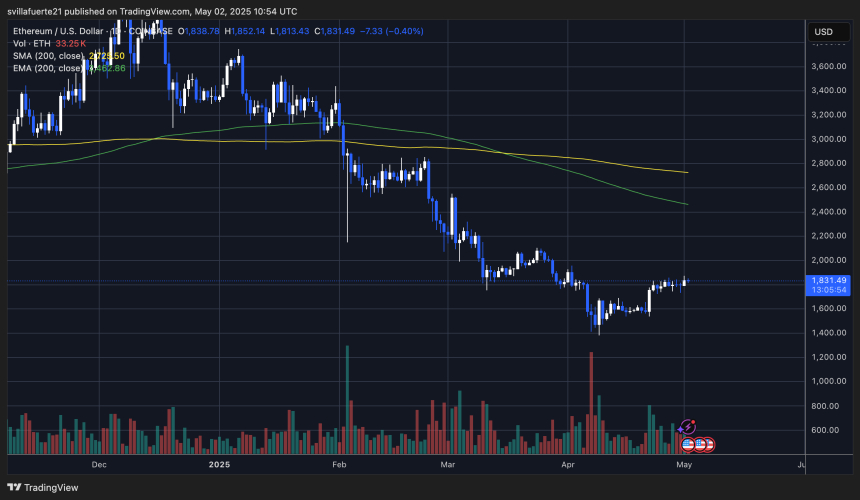
Ethereum is currently trading at $1,830, holding firm after several days of tight consolidation between $1,750 and $1,850. This narrow range has defined recent price action, as bulls and bears remain locked in a standoff near key resistance. For bulls to maintain control and confirm a reversal structure, a decisive breakout above the $1,850 level is critical. Reclaiming the $2,000 zone would likely spark renewed buying momentum and shift short-term sentiment in favor of the upside.
However, the longer ETH stays capped below resistance, the greater the risk of a breakdown. If bulls fail to push above the $1,850 level soon, selling pressure may intensify. A loss of support at $1,750 could open the door for a move back toward the $1,700 zone. Further weakness from there could drag ETH down to retest the $1,500 level, where demand previously stepped in.
Related Reading
With macroeconomic uncertainty still weighing on markets and Ethereum underperforming relative to Bitcoin, traders are watching closely for a decisive move. Until then, ETH remains trapped in a tight range where momentum is building, and a breakout or breakdown is likely just around the corner.
Featured image from Dall-E, chart from TradingView
Credit: Source link


