


Rebeca Moen
Mar 16, 2026 08:00
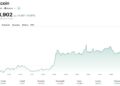
DOT price prediction shows bullish momentum with 11.56% daily gains. Technical analysis points to $1.72 resistance test, with medium-term Polkadot forecast targeting $1.65-$1.80 range.
DOT Price Prediction Summary
• Short-term target (1 week): $1.65-$1.72
• Medium-term forecast (1 month): $1.45-$1.85 range
• Bullish breakout level: $1.72
• Critical support: $1.46
What Crypto Analysts Are Saying About Polkadot
While specific analyst predictions are limited in recent market commentary, on-chain data reveals strengthening momentum for DOT. According to technical indicators from major trading platforms, Polkadot is showing renewed bullish signals after breaking above key moving averages.
The 11.56% daily price surge has captured attention from institutional traders, with Binance spot volume reaching $19.26 million in the past 24 hours. This volume spike suggests growing confidence in DOT’s near-term trajectory, particularly as the token approaches critical resistance zones.
DOT Technical Analysis Breakdown
Polkadot’s current technical setup presents a compelling bullish case. At $1.58, DOT is trading above all short-term moving averages, with the 7-day SMA at $1.49 and 20-day SMA at $1.52 providing strong support. However, the 200-day SMA at $2.53 remains a significant overhead resistance, indicating the longer-term downtrend is still intact.
The RSI reading of 57.04 places DOT in neutral territory, suggesting there’s room for additional upside before entering overbought conditions. The MACD histogram at 0.0000 with bullish momentum confirms the recent breakout attempt, while the Stochastic indicators (%K at 90.95, %D at 72.76) show strong short-term momentum but approach overbought levels.
Bollinger Bands analysis reveals DOT positioned at 0.71 between the bands, with the upper band at $1.66 acting as immediate resistance. The middle band at $1.52 has transformed from resistance to support, a positive technical development for this DOT price prediction.
Polkadot Price Targets: Bull vs Bear Case
Bullish Scenario
In an optimistic scenario, DOT could test the strong resistance at $1.72 within the next week, representing a 9% upside from current levels. A successful break above this level could open the path toward $1.85, where longer-term resistance converges with psychological barriers.
The bullish case relies on sustained volume above $15 million daily and RSI remaining below 70. A break above the upper Bollinger Band at $1.66 with confirmation would signal the start of a more significant rally phase for this Polkadot forecast.
Bearish Scenario
The downside scenario sees DOT failing to hold above the pivot point at $1.53, potentially leading to a retest of immediate support at $1.46. A break below this level could trigger stops and push prices toward the strong support zone at $1.34.
Key risk factors include broader market weakness, failure to maintain above the 20-day SMA at $1.52, and RSI divergence if price makes new highs while momentum indicators weaken.
Should You Buy DOT? Entry Strategy
For traders considering DOT positions, the current level around $1.58 offers a reasonable risk-reward setup. Conservative entries could wait for a pullback to the $1.52-$1.53 support zone, which aligns with the 20-day SMA and previous resistance turned support.
Aggressive traders might consider entries on any dips toward $1.55, with stop-losses below $1.46 to limit downside risk. The target zone of $1.65-$1.72 provides a favorable 4-8% upside potential against a 6-7% stop-loss distance.
Position sizing should account for DOT’s daily ATR of $0.08, indicating typical daily price swings of approximately 5%. This volatility measurement helps determine appropriate position sizes for risk management.
Conclusion
This DOT price prediction suggests cautious optimism for Polkadot’s near-term prospects. The technical setup supports a move toward $1.72 resistance, with the Polkadot forecast indicating potential for $1.65-$1.80 range trading over the coming month.
However, traders should remain vigilant of the broader market context and DOT’s position well below its 200-day moving average. While short-term momentum appears bullish, longer-term recovery will require sustained buying pressure and successful navigation of overhead resistance levels.
Disclaimer: Cryptocurrency price predictions are speculative and should not constitute financial advice. Always conduct your own research and consider your risk tolerance before making investment decisions.
Image source: Shutterstock
Credit: Source link


