• Live Crypto Prices
  • Crypto News
    • Worldwide
      • Bitcoin
      • Ethereum
      • Altcoin
      • Blockchain
      • Regulation
    • Australian Crypto News
  • Education
    • Cryptocurrency For Beginners
    • Where to Buy Cryptocurrency
    • Where to Store Cryptos
    • Cryptocurrency Tax in Australia 2021
No Result
View All Result
CryptoABC.net
No Result
View All Result

Dogecoin Has Formed A Bullish Reversal Pattern, What’s Next?

June 28, 2022
in Bitcoin
Reading Time: 4min read
0 0
A A
0
Dogecoin Has Formed A Bullish Reversal Pattern, What’s Next?
0
SHARES
7
VIEWS
ShareShareShareShareShare

Dogecoin’s price has been optimistic over the last week. The coin secured double digit gains over the last seven days, it rose by nearly 20%. The meme-coin has been experiencing rigid resistance at the $0.07 level and if it trades around the current price level, it could fall to its next support line of $0.05.

The bulls have tried to show signs of recovery as the coin tried to move upwards slowly over the past few days. On the shorter time frame, DOGE has lost some of its market value. Over the last 24 hours, Dogecoin depreciated by 4%.

Technical outlook for the coin has also depicted some bullishness as the coin went north by almost 20%. Buying strength also recovered over the last week, but as the meme-coin depicted some bearishness over the shorter time frame, currently sellers are more in number.

Even though on the four-hour chart DOGE depicted negative price movement, the coin has displayed a bullish reversal pattern. The global cryptocurrency market cap today is $979 Billion with a 2.9% fall in the last 24 hours.

Dogecoin Price Analysis: One Day Chart

Dogecoin flashed a bullish reversal on the one day chart | Source: DOGEUSD on TradingView

DOGE was priced at $0.072 on the one hour chart. The coin has been stuck at the same resistance level for a couple of weeks now. A fall from the current price level will push Dogecoin to $0.060, failing to stay above which the coin can attempt to trade at $0.047.

Overhead resistance for the coin stood at $0.08 and then at $0.09. On a relatively longer time frame, the coin has formed a bullish reversal pattern.

The pattern is called the BARR Bottom pattern. The BARR Bottom pattern is referred to as a bump-and-run reversal bottom pattern.

This technical pattern is tied to an extended trend reversal in an ongoing bear market. The pattern is characterised by three phases which are the Lead-In phase, Bump and finally the Run phase.

At the current moment, Dogecoin was in the bump phase which will be followed by the run phase that will overturn the bearish price action.

If this happens the coin could touch the $0.090 and then the $0.011 level. Volume of Dogecoin traded fell indicating that the buying strength has fallen on the chart.

Technical Analysis

Dogecoin
Dogecoin noted a small downtick in buying strength on the four hour chart | Source: DOGEUSD on TradingView

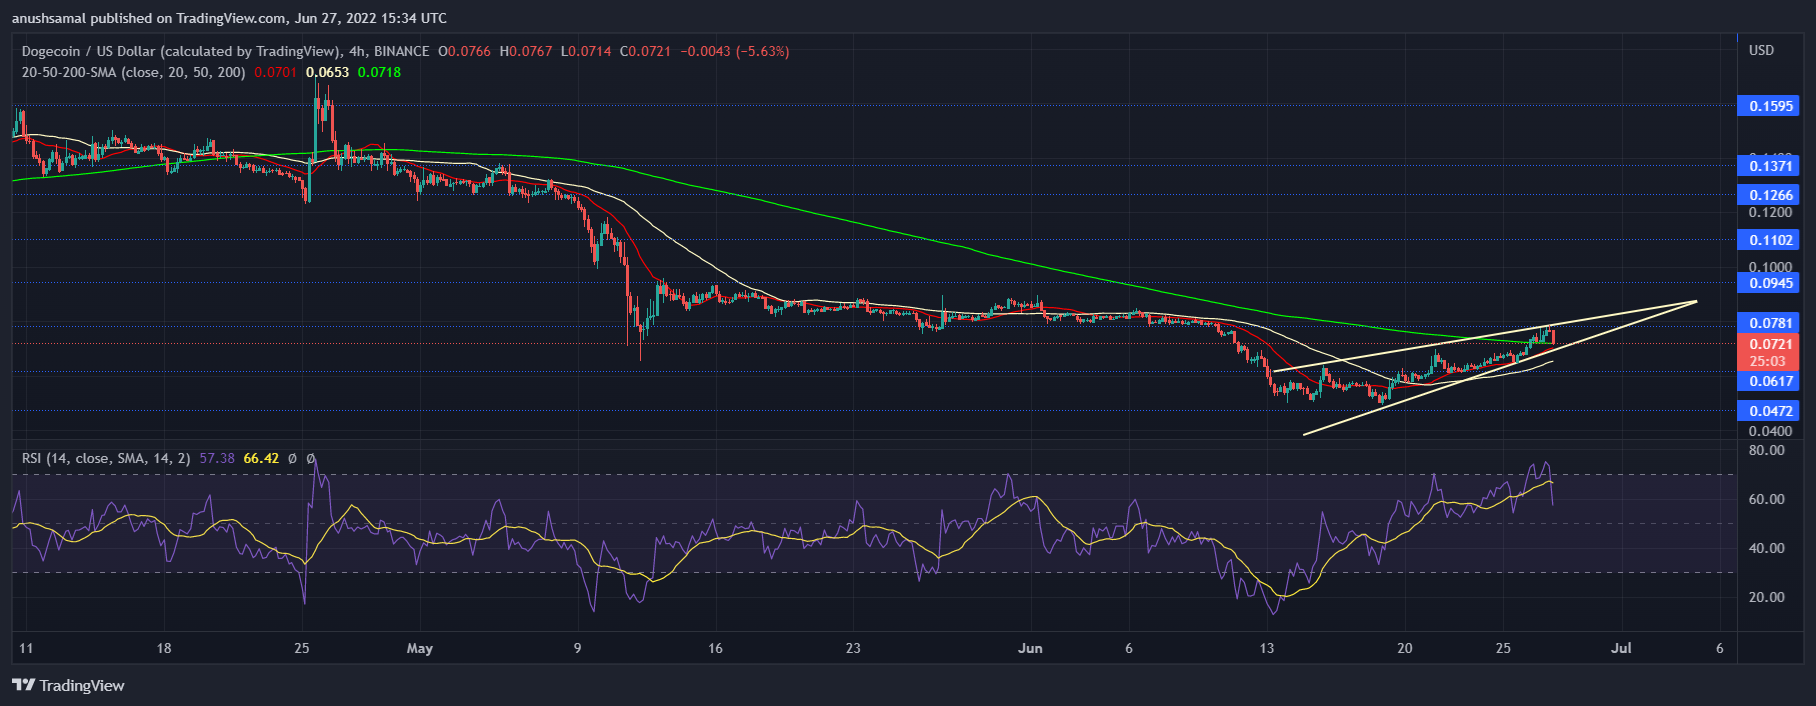
DOGE was inclining towards a bearish price action. It even formed a rising wedge pattern on the four hour chart.

The Relative Strength Index also depicted a downtick signifying that buyers were fading out of the market. A rising wedge pattern is tied to a bearish price signal.

It could be possible that over the immediate trading sessions DOGE might register some bearishness. On the longer time frame, the coin could recover.

On the 20-SMA indicator, the coin was above the 20-SMA line. This indicated that despite falling buying pressure, buyers were still driving the price momentum.

Related Reading | TA: Ethereum Bulls In Control, Why ETH Could Clear $1,300

Dogecoin
Dogecoin flashed a sell signal on the four hour chart | Source: DOGEUSD on TradingView

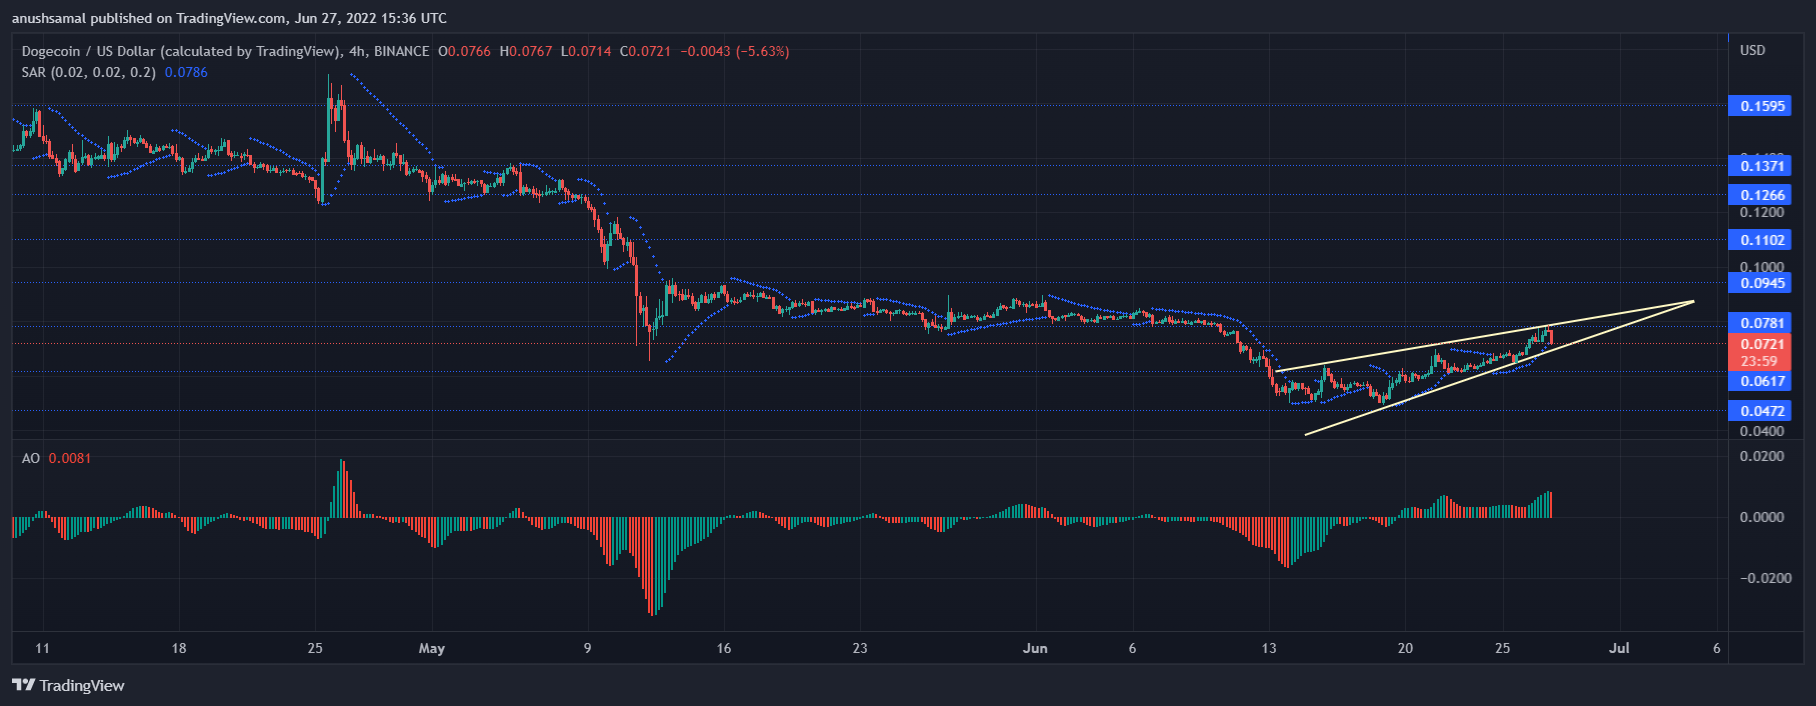
In consonance with the technical outlook on the four-hour chart, the coin registered a sell signal. The Awesome Oscillator which depicts the price momentum painted a red signal bar.

The red signal bar is tied to a sell signal on the chart. Parabolic SAR indicates the current trend and also the trend reversals.

Dotted lines underneath the candlesticks are a signal of bearishness on the chart. It could be so that that the coin might dip over the immediate trading sessions and then move upwards.

Related Reading | Cardano Formed This Pattern On Its Chart, Where Is The Coin Headed?

Featured image from Unsplash.com, chart from TradingView.com

Credit: Source link

ShareTweetSendPinShare
Previous Post

Goldman Sachs Is Raising $2 Billion To Buy Celsius’ Assets

Next Post

Australia’s Crypto Processing Firm Banxa to Lay off One-Third of its Staff

Next Post
Australia’s Crypto Processing Firm Banxa to Lay off One-Third of its Staff

Australia's Crypto Processing Firm Banxa to Lay off One-Third of its Staff

You might also like

Bitcoin Analyst Predicts Lowest Level Before Run To $200,000

Bitcoin Analyst Predicts Lowest Level Before Run To $200,000

April 22, 2026
Pundit Predicts When XRP Price Will Hit $500 And What Will Drive The Rally

Pundit Predicts When XRP Price Will Hit $500 And What Will Drive The Rally

April 24, 2026
Fed Chair Pick Kevin Warsh Says Crypto Is Already Embedded in Finance, Signals Support Without Backing CBDC

Fed Chair Pick Kevin Warsh Says Crypto Is Already Embedded in Finance, Signals Support Without Backing CBDC

April 22, 2026
Onramp Launches New Bitcoin Finance Platform for BTC-Native Services

Onramp Launches New Bitcoin Finance Platform for BTC-Native Services

April 22, 2026
Bitfinex Says Expect Bullish Q4 as Bitcoin on Track for Significant Move

Bitcoin’s Bullish Signals Strengthen Despite Recent Hash Rate Dip

April 27, 2026
VeChain Foundation Releases Q1 2024 Treasury Report

Altcoins Could Rally 60% If Bitcoin Hits $86K, Says Analyst

April 24, 2026
CryptoABC.net

This is an Australian online news/education portal that aims to provide the latest crypto news, real-time updates, education and reviews within Australia and around the world. Feel free to get in touch with us!

What's New Here!

XRP Ledger Hits New RWA Milestone, But Will This Have Any Impact On The Price?

XRP Ledger Hits New RWA Milestone, But Will This Have Any Impact On The Price?

April 28, 2026
XRP Price Prediction: $1.40 Broken – Double Down or Cut Loss?

XRP Price Prediction: $1.40 Broken – Double Down or Cut Loss?

April 28, 2026

Subscribe Now

  • Contact Us
  • Privacy Policy
  • Terms of Use
  • DMCA

© 2021 cryptoabc.net - All rights reserved!

No Result
View All Result
  • Live Crypto Prices
  • Crypto News
    • Worldwide
      • Bitcoin
      • Ethereum
      • Altcoin
      • Blockchain
      • Regulation
    • Australian Crypto News
  • Education
    • Cryptocurrency For Beginners
    • Where to Buy Cryptocurrency
    • Where to Store Cryptos
    • Cryptocurrency Tax in Australia 2021

© 2021 cryptoabc.net - All rights reserved!

Welcome Back!

Login to your account below

Forgotten Password?

Create New Account!

Fill the forms below to register

All fields are required. Log In

Retrieve your password

Please enter your username or email address to reset your password.

Log In
Please enter CoinGecko Free Api Key to get this plugin works.