As the bulls regained strength over the past few days, major cryptocurrencies witnessed considerable respite. Following impressive gains, Dogecoin has soared a substantial 8% over the last 24 hours. The coin was changing hands at $0.151 at the time of writing. Market movers were seen trading in the green, as a reason altcoins also jumped north on their charts.
Following bullish sentiments across the market, the global cryptocurrency market cap stood at $2.26 Trillion after a 6.7% positive change. Bitcoin was trading at $47,800, which marked a multi-month high for the coin, and Ethereum was priced at $3400, a level it last touched in the month of January.
Related Reading | Bitcoin Likely To Continue Upward Trajectory, Is $50K Its Next Target?
Dogecoin Price Analysis: Four Hour Chart
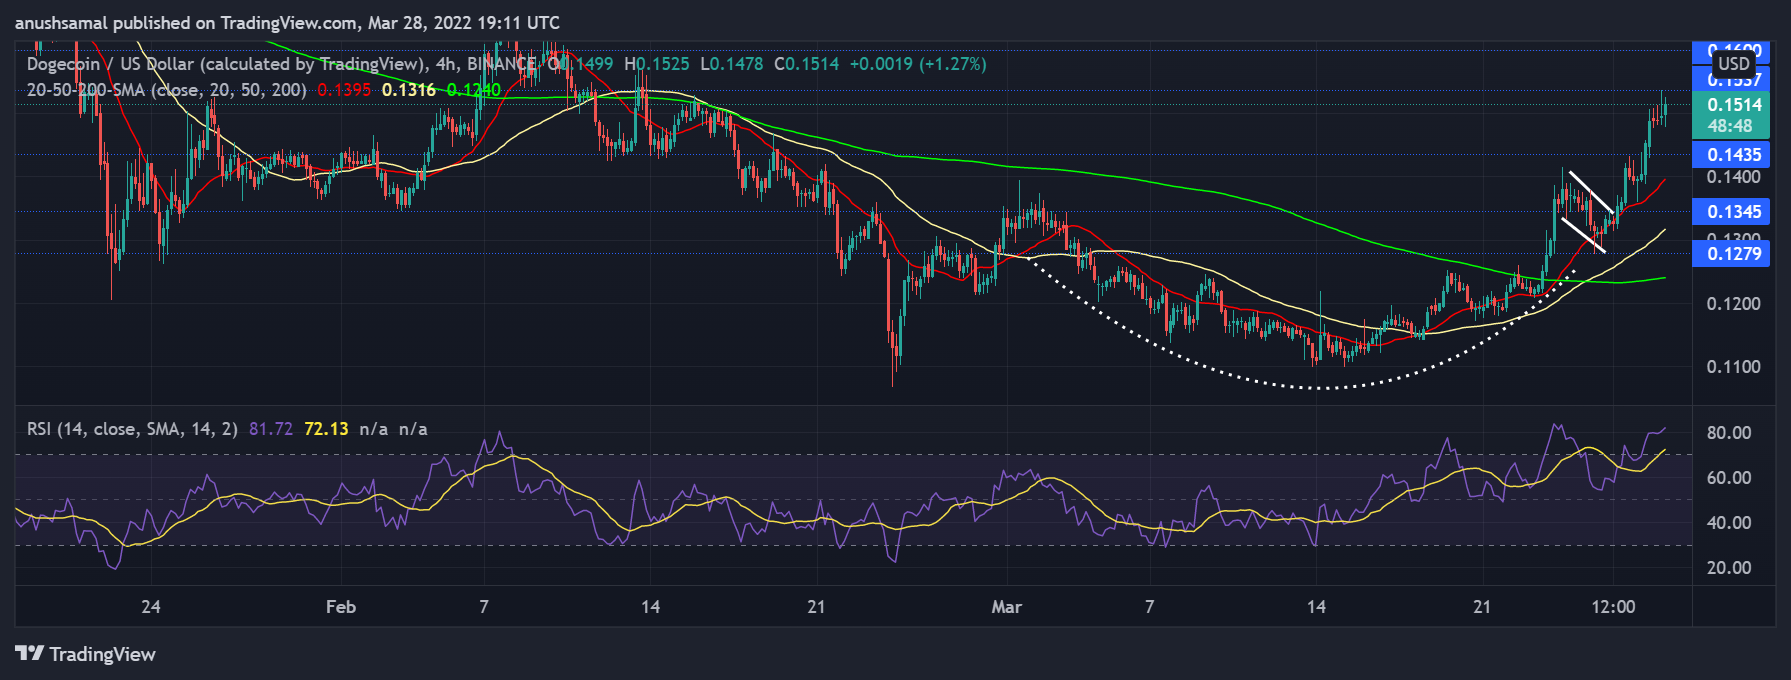
Dogecoin was seen trading within an ascending channel (white), which is considered to be bullish. Over the past week, Doge has surged close to 26%. The meme-coin was further fueled by Elon Musk’s Tweet which spoke of how he found the idea of replacing Twitter’s logo with that of Doge’s impressive.
This comment was in line with Musk’s recent tweet which suggested that Twitter isn’t a platform that lets users exercise their freedom of speech. Post these tweets, Dogecoin registered another double-digit jump in a matter of a day. The volume traded in the previous session was also in green suggesting that the price action was positive.
The overhead resistance for the coin stood at $0.160, the meme-coin last traded near that level in the month of February. Continued push from the bulls could cause the coin to revisit the above-mentioned resistance line. On the flip side, a price retraction would mean Doge trade near the $0.143 and then $0.134 support levels respectively.
Technical Analysis

Dogecoin has been traveling back and forth from the overbought territory. With the bulls strengthening with each passing day, the meme-coin has continued to secure more and more buyers. The Relative Strength Index which is indicative of buying strength was parked above the 80-mark. This reading symbolizes overvalued tendencies.
Correspondingly, the price of the coin was seen trading above the 20-SMA line which signified a bullish stance. This meant that the buyers in the market were responsible for driving the price momentum at the moment.
Dogecoin could continue to move in a northbound direction further, given the cup and handle pattern (indicated in white) that the coin has formed on its charts. The cup and handle pattern is spotted when the market is extremely bullish. The meme-coin could attempt to trade above its immediate resistance of the $0.160 price level.
Related Reading | Short Traders Get the Short End Of The Stick As Bitcoin Breaks $47,000

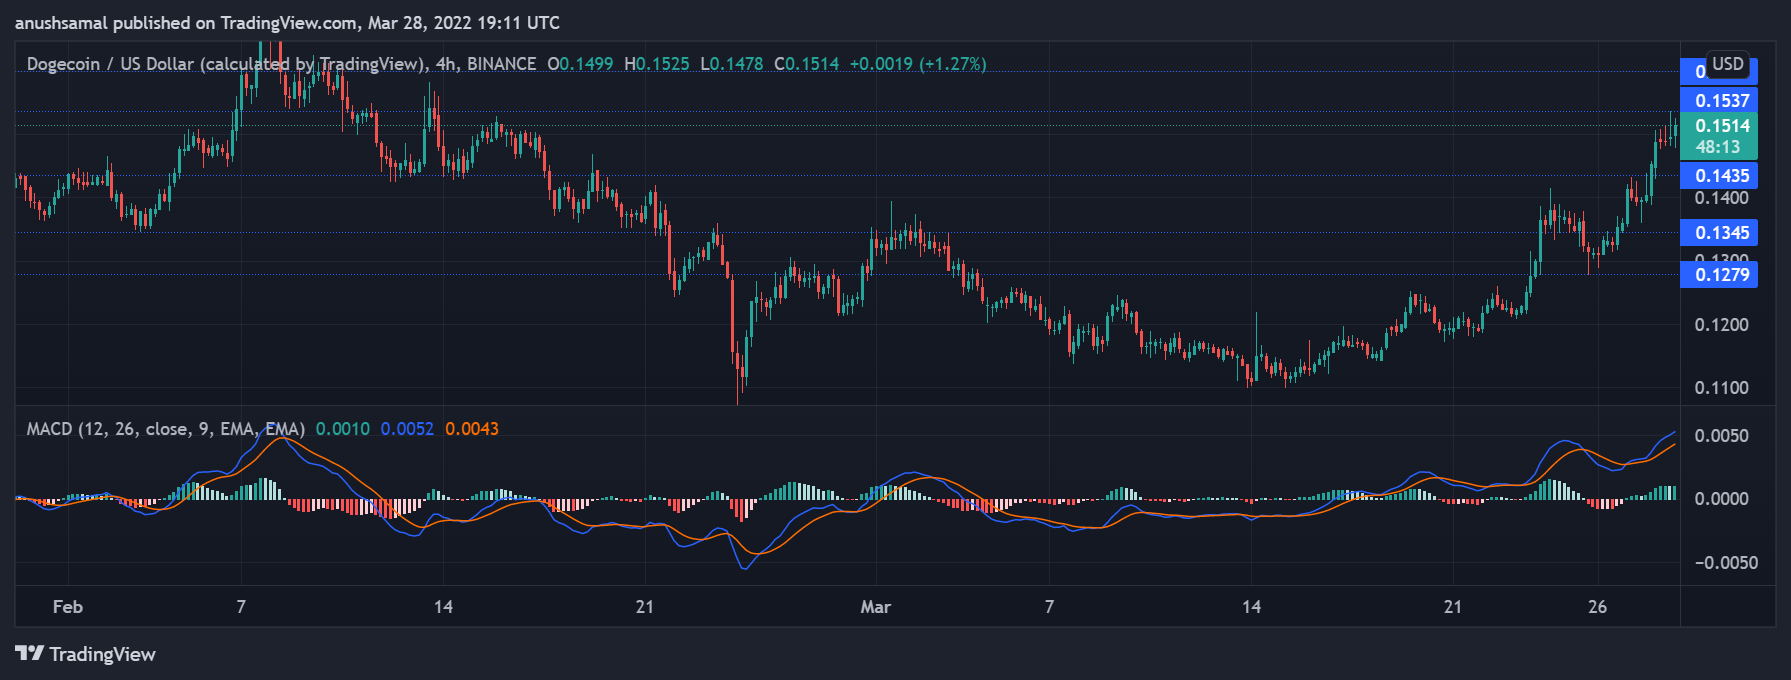
MACD indicates the market momentum of a particular coin. In regards to the other indicators, Dogecoin displayed a chance of moving further up which is characterized by a bullish momentum in the market. If Doge manages to break past the $0.153 price mark, the bulls might not fade out just yet.
On the four-hour chart, MACD experienced a bullish crossover and the indicator displayed amplified green histograms suggesting that the market momentum was still bullish at the time of writing.
Credit: Source link


