Reason to trust
![]()
Strict editorial policy that focuses on accuracy, relevance, and impartiality
Created by industry experts and meticulously reviewed
The highest standards in reporting and publishing
Strict editorial policy that focuses on accuracy, relevance, and impartiality
Morbi pretium leo et nisl aliquam mollis. Quisque arcu lorem, ultricies quis pellentesque nec, ullamcorper eu odio.
Este artículo también está disponible en español.
Ethereum’s price has now found itself stuck below $2,000 in the past seven days, and it looks like it will continue here into the next few days with little sign of a significant recovery. The second-largest cryptocurrency by market capitalization has struggled under downward pressure since early March, with sellers dominating the wider crypto market.
Interestingly, recent technical analysis using Elliott Wave theory suggests that bearish dominance will continue for Ethereum into the foreseeable future. The analysis, posted on TradingView, highlights the formation of an ABC correction pattern, which could dictate Ethereum’s next major move.
Ethereum’s Price Structure Points To Extended Correction
According to a crypto analyst known as behdark on the TradingView platform, Ethereum’s recent pivot formations, momentum shifts, and wave degrees all indicate an ongoing correction. This interesting outlook is based on the analyst’s count of Elliott Wave, which shows Ethereum appears to be forming an ABC correction pattern.
Related Reading
This ABC correction pattern has been playing out since November 2021 and has spanned the last three and half years. The ABC corrective trend is a three-wave pattern in the Elliott Wave Theory of major correction. Wave A represents the initial decline, wave B is a temporary retracement or countertrend move, and wave C is the final downward leg, often extending beyond wave A.
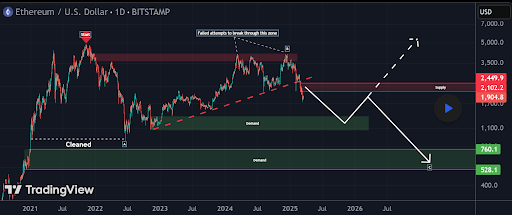
It would seem wave B, the second wave in the correction pattern, is now completed or nearing completion after Ethereum broke below a trendline around $2,500 in late February. This means that wave C is set to play out, which is going to extend the current bearish trend. The analyst noted that wave C should be a little bit longer in duration than wave A, hinting at a drawn-out decline to a big demand zone between $760 and $530.
Two Demand Zones Identified For ETH
The analyst outlined two possible market bottoms for Ethereum, referred to as “Demand 1” and “Demand 2.” The first demand zone is between $1,350 and $1,080, and this is where Ethereum might see some buying pressure that will help put an end to the continuation of wave C.
Related Reading
However, if the first demand zone fails to hold, the Ethereum price may experience an even deeper correction before finding stability. The next zone of stability, in this case, is between $760 and $530. A move to this level will no doubt send the sentiment surrounding Ethereum to an all-time low. However, it can also provide an opportunity for bullish traders to accumulate, as the next move after this zone is the beginning of the next five impulse waves.
Deviating from the negative outlook, the analyst pointed out an invalidation level at $2,941. If Ethereum manages to close a daily candle above this level, the bearish scenario would be nullified.
At the time of writing, Ethereum is trading at $1,930. Given the current structure of price action, the likelihood of Ethereum breaking above $2,941 in the short term appears slim.
Featured image from Unsplash, chart from Tradingview.com
Credit: Source link