


Let’s take a closer look at today’s altcoins showing breakout signals. We’ll explain what the coin is, then dive into the trading charts and provide some analysis to help you decide.
1. Ceek VR (CEEK)
CEEK is an award-winning developer of premium social virtual and augmented reality experiences. Its mission is to empower creators with the tools needed to generate new revenue streams from their artistry digitally. Ceek is helping music artists, athletes, event creators, and makers create exquisite direct to fan experiences that delight and drive long-term sustainable engagement within existing and emerging virtual worlds.
CEEK Price Analysis
At the time of writing, CEEK is ranked the 106th cryptocurrency globally and the current price is US$0.3247. Let’s take a look at the chart below for price analysis:
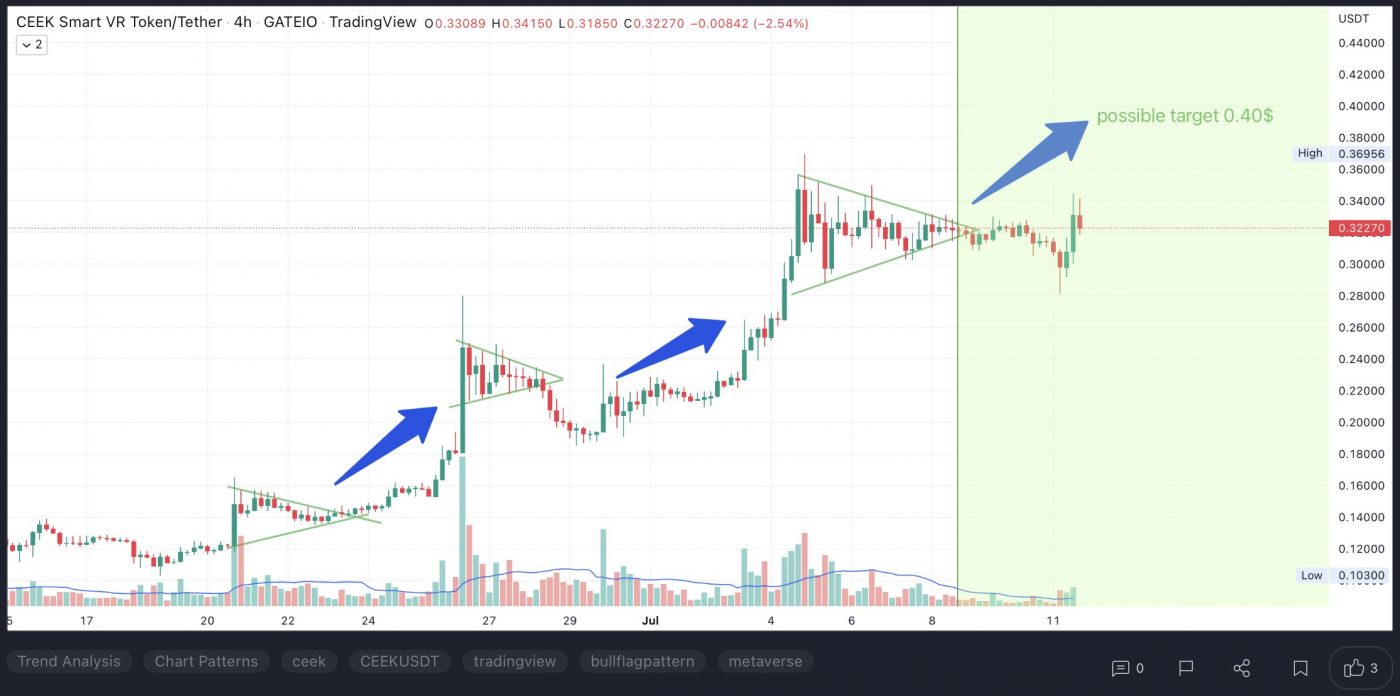
CEEK has bounced 320% from its early June low. It is filling in an area of inefficient trading formed from April to June.
The price is testing possible support near $0.2889. This area shows inefficient trading on the daily chart. It also overlaps with old swing lows, an old swing high, and the low end of inefficient trading on the weekly chart.
If this level fails to hold, the price might resume its bearish trend. The consolidation near the June monthly open could provide a speedbump for bears. This zone is between the recent rally’s 61.8% and 78.6% retracements. It also shows inefficient trading on the weekly and daily charts.
For now, an area near $0.3376 offers the closest resistance. This level overlaps with the recent swing high. It’s also near the top of an inefficiently traded area on the weekly chart.
If this level breaks, bulls may be targeting $0.3850 next. Here, the price broke down in late April from its consolidation. As it broke down, it formed an area of inefficient trading on the weekly and daily charts.
If the rally continues, $0.4445 might offer the next resistance. The 9, 18, and 40 EMAs flipped bearish near this level. It’s also near the midpoint of April’s consolidation range. This midpoint is near the 61.8% retracement of the late April and early May drop.
2. Filecoin (FIL)
Filecoin FIL is a decentralised storage system that aims to “store humanity’s most important information”. The project was first described back in 2014 as an incentive layer for the Interplanetary File System (IPFS), a peer-to-peer storage network. Filecoin is an open protocol backed by a blockchain that records commitments made by the network’s participants, with transactions using FIL, the blockchain’s native currency. The blockchain is based on both proof-of-replication and proof-of-spacetime.
FIL Price Analysis
At the time of writing, FIL is ranked the 39th cryptocurrency globally and the current price is US$5.37. Let’s take a look at the chart below for price analysis:
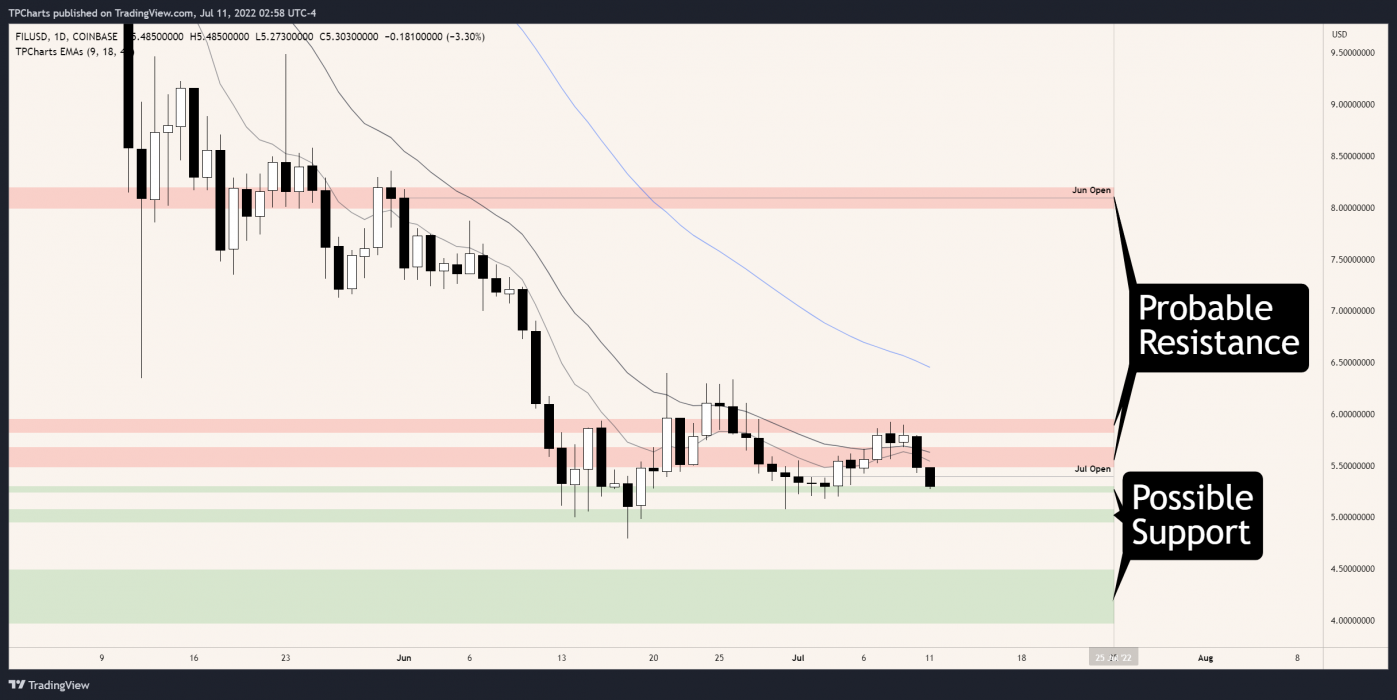
FIL has dropped 83% from its April high. It found support near $5.080 before starting a consolidation range.
This level, near the lows, could continue to provide support. A year-long consolidation from 2019 to 2020 pivoted around this level many times. It’s also near the middle of the last down candle before 2020’s massive rally. A retest of this level would run bulls’ stops under swing lows formed in late June and early July.
The price is testing a closer area of possible support near $5.3010. Bulls rejected bears many times in early July at this level. It’s also in the upper part of June 18th’s swing low candle.
The closest resistance is likely near $5.485. This area, up to $5.680, shows inefficient trading on the daily chart. It also contains the 9 and 18 EMAs.
If the price breaks through this level, it may aim for bears’ stops above $5.9250. Even if it doesn’t reach these stops, the area between $5.8210 and $5.9525 could provide a bearish setup. Here, bears rejected bulls near the bottom of an area of inefficient trading on the weekly chart.
If the market turns more bullish, a rally beginning in this range may be aiming for the June monthly open, near $7.990. This level is near the bottom of an area of inefficient trading on the monthly chart. The daily chart also shows that bears rejected bulls here before June’s drop.
3. STEPN (GMT)
Stepn GMT is a self-styled “Web3 lifestyle app” with GameFi elements on the Solana blockchain. It combines aspects of a play-to-earn game with a fitness app to create a new category coined “move-to-earn.” Users buy NFT sneakers, which they can use to earn in-game currency while walking, running, or jogging. STEPN aims to revolutionize the market of fitness applications by incentivizing millions of users to follow a healthier lifestyle. The app solves several problems like “proof of movement” – proving that users really exercised – and a functioning GPS system. Moreover, STEPN incentivizes users financially and plans to introduce social rewards elements and successfully contributes to carbon neutrality.
GMT Price Analysis
At the time of writing, GMT is ranked the 69th cryptocurrency globally and the current price is US$0.8755. Let’s take a look at the chart below for price analysis:
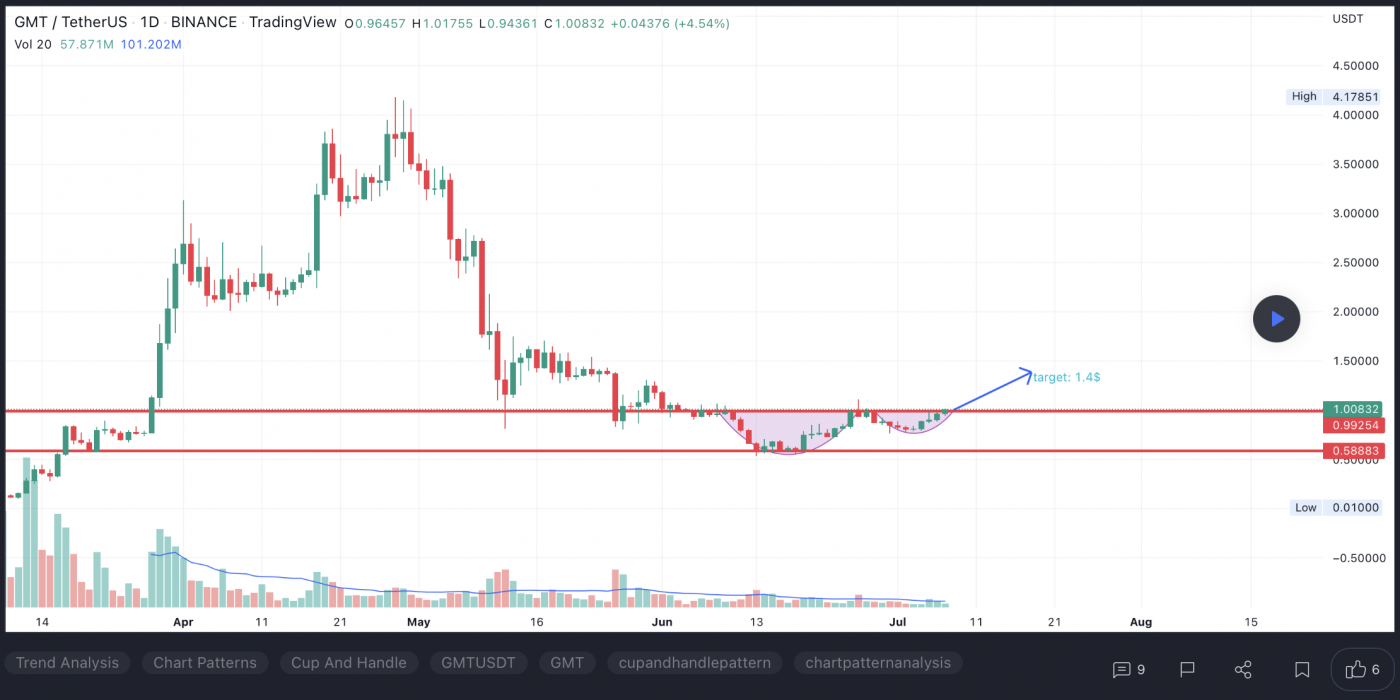
GMT has retraced much of 2022’s parabolic run. It dropped 87% from its April high before rallying in mid-June.
Bulls are testing $0.8718 to see if it can hold as support. This area shows inefficient trading on the daily chart. It’s also near the top of early July’s accumulation before the most recent rally.
Even if the price eventually moves higher, it may first drop under the July monthly open to an area near $0.8099. Bulls rejected bears in early July at this level. It also overlaps with an area of accumulation in late June.
If the market sees this as bearish, a retest of $0.9514 could prove this level as resistance. Bears already rejected bulls once here. This level also contains the 40 EMA and is inefficiently traded on the daily chart.
A break through this resistance could retest an old area of inefficient trading, near $1.0832. The target would likely be bulls’ stops above highs at $1.1130 and $1.0557.
If the price reaches this level, it might go one step further and retest the June monthly open near $1.1651. This level is at the low end of inefficient trading on the monthly chart. It’s also the origin of early June’s sudden breakdown.
Yet, while the market remains bearish, traders may want to focus on bearish scenarios. Rejection from any resistance might reach near $0.6813. This area shows inefficient trading on the daily chart. Bulls also rejected bears here on the weekly chart before starting June’s rally.
Below this level, $0.5346 may be the next target if the bearish trend continues. This area shows inefficient trading on the daily and weekly charts. It’s also just below relative equal lows, formed in mid-June. Bulls’ stops under these lows offer attractive targets to bears.
Learn How to Trade Live!
Join Dave and The Crypto Den Crew and they’ll show you live on a webinar how to take your crypto trading to the next level.

Where to Buy or Trade Altcoins?
These coins have high liquidity on Binance Exchange, so that could help with trading on AUD/USDT/BTC pairs. And if you’re looking at buying and HODLing cryptos, then Swyftx Exchange is an easy-to-use popular choice in Australia.
Disclaimer:
The content and views expressed in the articles are those of the original authors own and are not necessarily the views of Crypto News. We do actively check all our content for accuracy to help protect our readers. This article content and links to external third-parties is included for information and entertainment purposes. It is not financial advice. Please do your own research before participating.
Credit: Source link


