Bitcoin surpassed above 40K before falling back to stand above the $36.8K level. The breakthrough was partly boosted by e-commerce giant Amazon Inc hinting that it would allow its users to pay for products using cryptocurrencies before the company denying it. Meanwhile, the platform still intends to hire blockchain and digital currency expert talent to manage and develop its crypto payment system.
BTC has surpassed the $40K level, touching the high of $40,499 level over the past 24 hours before falling back and standing above the $36.8K level, according to CoinMarkCap.
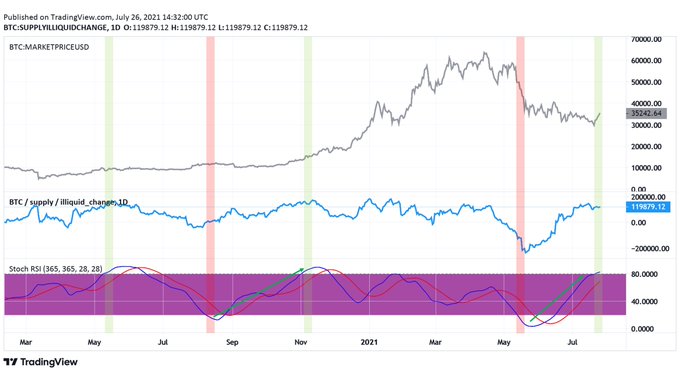
On-chain analyst Will Clemente believes that BTC’s supply squeeze is just getting started. He explained:
“Illiquid Supply RSI has flashed the first buy signal since November of last year. The supply squeeze is just getting started. This looks at the broader trend change in accumulation behavior by running a 365-day stoch RSI over the 30-day net change of illiquid supply.”
Crypto analytic firm Dilution-proof recently pointed out that bulls had created a great setup for a short-squeeze based on Bitcoin’s $3k intraday move despite futures markets remaining short. A short-squeeze usually prompts rapidly rising prices in tradable assets.
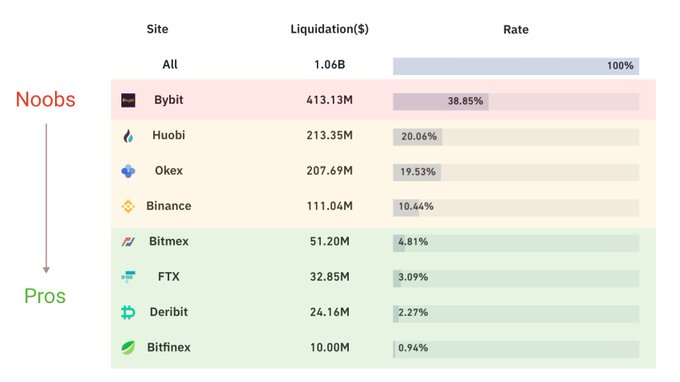
$1 billion BTC futures liquidated
According to market analyst Willy Woo:
“$1b of BTC futures liquidations in the last 12 hours.”
The upward momentum in the BTC market caused some traders to be caught in a massive liquidation. As a result, total liquidations in the cryptocurrency ecosystem topped $1 billion.
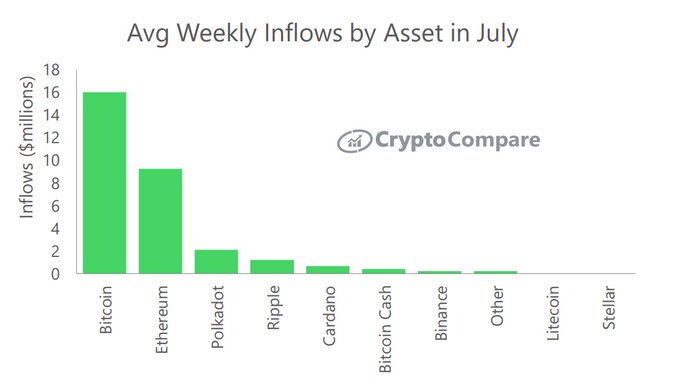
Meanwhile, average weekly inflows into Bitcoin hit $16 million, as acknowledged by CryptoCompare. The on-chain data provider noted:
“Average weekly inflows were positive in July – increasing from an average of -$59.5m in June to $58.5m. Weekly inflows into Bitcoin-based products averaged $16.0m. This was followed by Ethereum-based products with $9.3m and Polkadot-based products with $2.1m.”
As Bitcoin recently reclaimed the 50-day moving average (MA), is the 200-day MA next? If this happens, it will confirm an uptrend because this indicator shows the average of 40 weeks of trading.
Image source: Shutterstock
Credit: Source link


