Bitcoin bull runs have historically been triggered by supply squeezes. A number of indicators suggest that a bullish move may be in progress.
Indications of a Supply Squeeze
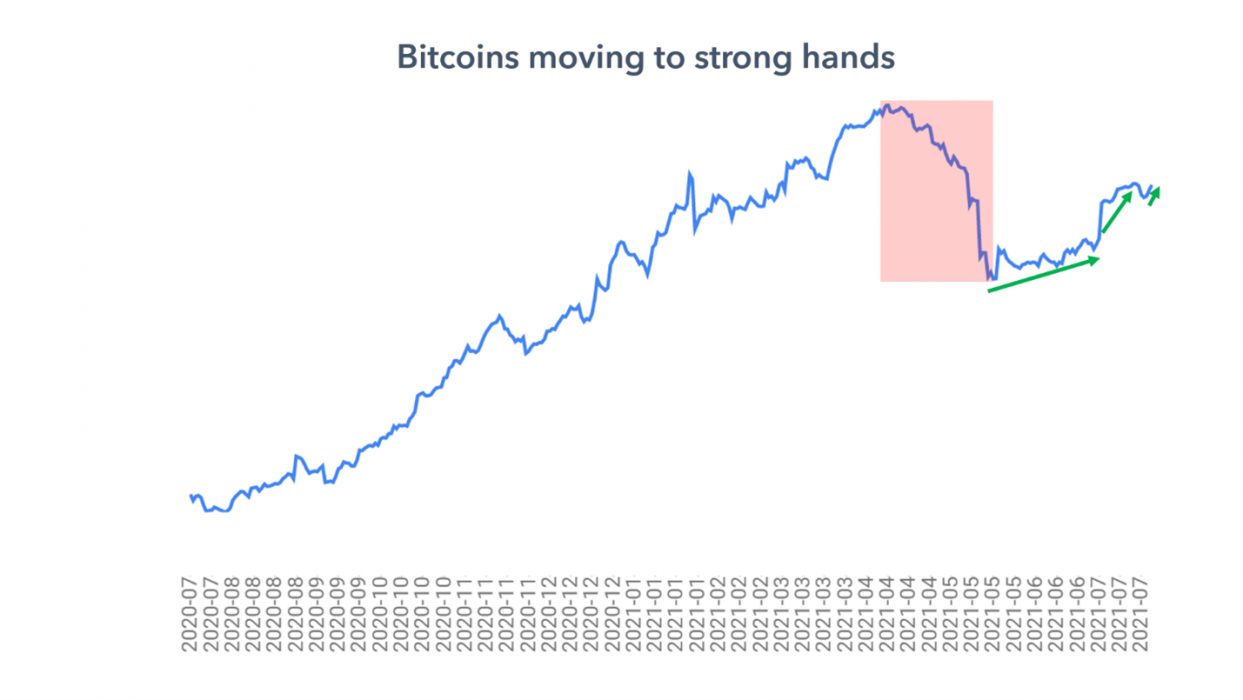
During Q3 2020, long-term holders (LTHs) controlled 80 percent of the supply. Today, that figure is 75 percent and growing, according to on-chain analytics.
Bitcoin’s supply shock is currently equivalent to levels it was at earlier this year, between US$50K – US$60K a coin. The two charts that follow illustrate the shift in coins towards LTHs:

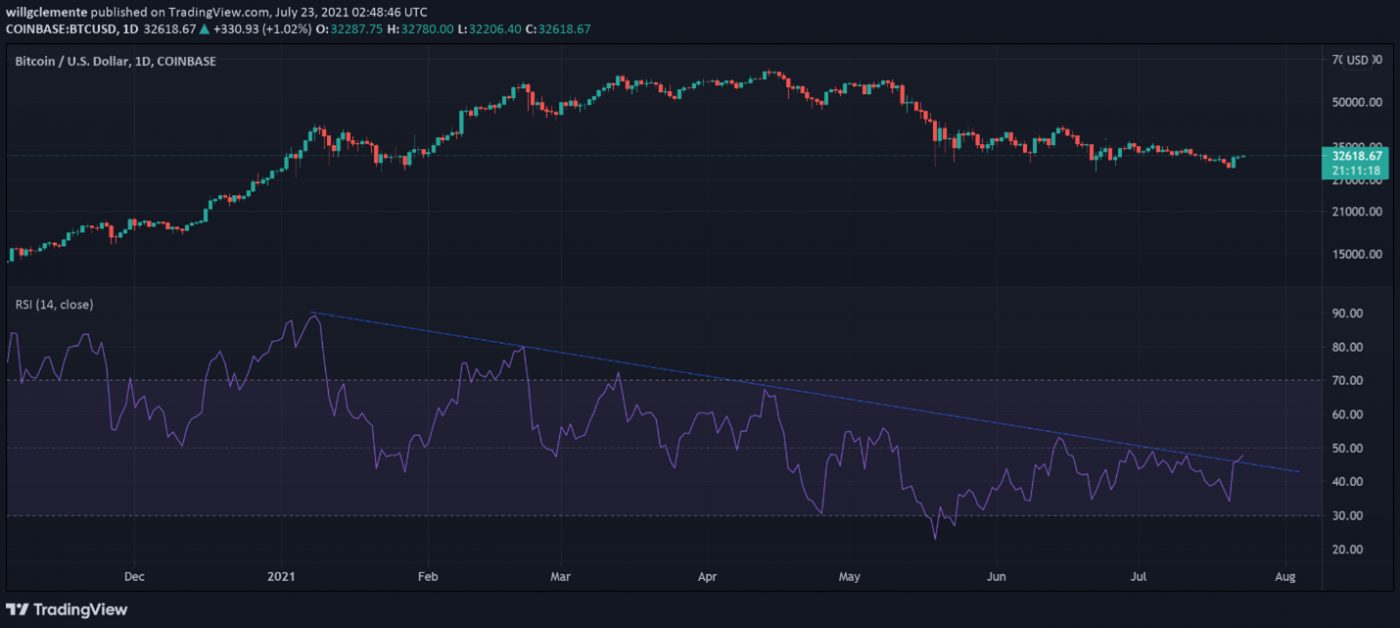
Another bullish indicator to be aware of is the relative strength index (RSI), a momentum tool used to identify overbought and oversold levels. Generally:
- values of 70 or above indicate that an asset is becoming overbought
- values of 30 or below indicate that an asset is oversold or undervalued
The RSI has been in a downtrend for seven months but may be turning a corner, as illustrated below:

On-chain analyst Willy Woo also has his eyes on the RSI:
Another interesting metric showing evidence of a potential short squeeze is the the perpetual funding rate. This is the mechanism that pegs the perpetual contract to the index (weighted average price of all major exchanges). When funding is positive, longs are paying shorts to keep their positions open; when negative, vice versa.
Generally, prolonged positive funding is bearish, whereas prolonged negative funding rates is bullish. We’ve seen mostly negative funding rates since late May. The last time we had prolonged negative funding like this was following the March 2020 Covid-19 capitulation, after which the price dramatically rose to an all-time high in December.
Supply Squeeze in Action?
After months of sideways action and a drop below US$30,000 amid market fear, Bitcoin seems to be turning a corner. Last week, Crypto News Australia reported that there was evidence of Bitcoin bears retreating, and perhaps this is coming to fruition.
At the time of writing, Bitcoin has been making sharp bullish moves suggesting that a supply squeeze may in fact be underway. Consider Bitcoin’s recent performance:
- 1 Month: +24.67%
- 1 Week: +20.67%
- 24-Hours: 12.96%
Evidently, things tend to move fast in crypto. At the time of publication, Bitcoin was trading at US$38,228.
Disclaimer:
The content and views expressed in the articles are those of the original authors own and are not necessarily the views of Crypto News. We do actively check all our content for accuracy to help protect our readers. This article content and links to external third-parties is included for information and entertainment purposes. It is not financial advice. Please do your own research before participating.
Credit: Source link


