• Live Crypto Prices
  • Crypto News
    • Worldwide
      • Bitcoin
      • Ethereum
      • Altcoin
      • Blockchain
      • Regulation
    • Australian Crypto News
  • Education
    • Cryptocurrency For Beginners
    • Where to Buy Cryptocurrency
    • Where to Store Cryptos
    • Cryptocurrency Tax in Australia 2021
No Result
View All Result
CryptoABC.net
No Result
View All Result

Bitcoin Top Here? What Historical HODLer Selloff Pattern Says

December 17, 2024
in Bitcoin
Reading Time: 2min read
0 0
A A
0
Bitcoin Top Here? What Historical HODLer Selloff Pattern Says
0
SHARES
12
VIEWS
ShareShareShareShareShare

On-chain data shows the Bitcoin long-term holders are selling. Here’s whether the current level of selloff is enough for a price top or not.

Bitcoin Long-Term Holders Have Been Selling Big Recently

In a new post on X, analyst Ali Martinez has discussed about the historical trend in the holdings of the long-term holders relative to the Bitcoin top. The “long-term holders” (LTHs) refer to the BTC investors who have been holding onto their coins for more than 155 days.

The LTHs represent one of the two main divisions of the BTC market done on the basis of holding time, with the other group being known as the short-term holders (STHs).

Historically, the latter cohort has proven to contain the weak hands of the market, while the former is made up of the HODLers who barely react to rallies and crashes in the price.

As such, selling from the STHs is usually not of any note, but that from the LTHs can be, as it’s not a particularly common event. One way to keep track of the behavior of the diamond hands is through their Net Position Change.

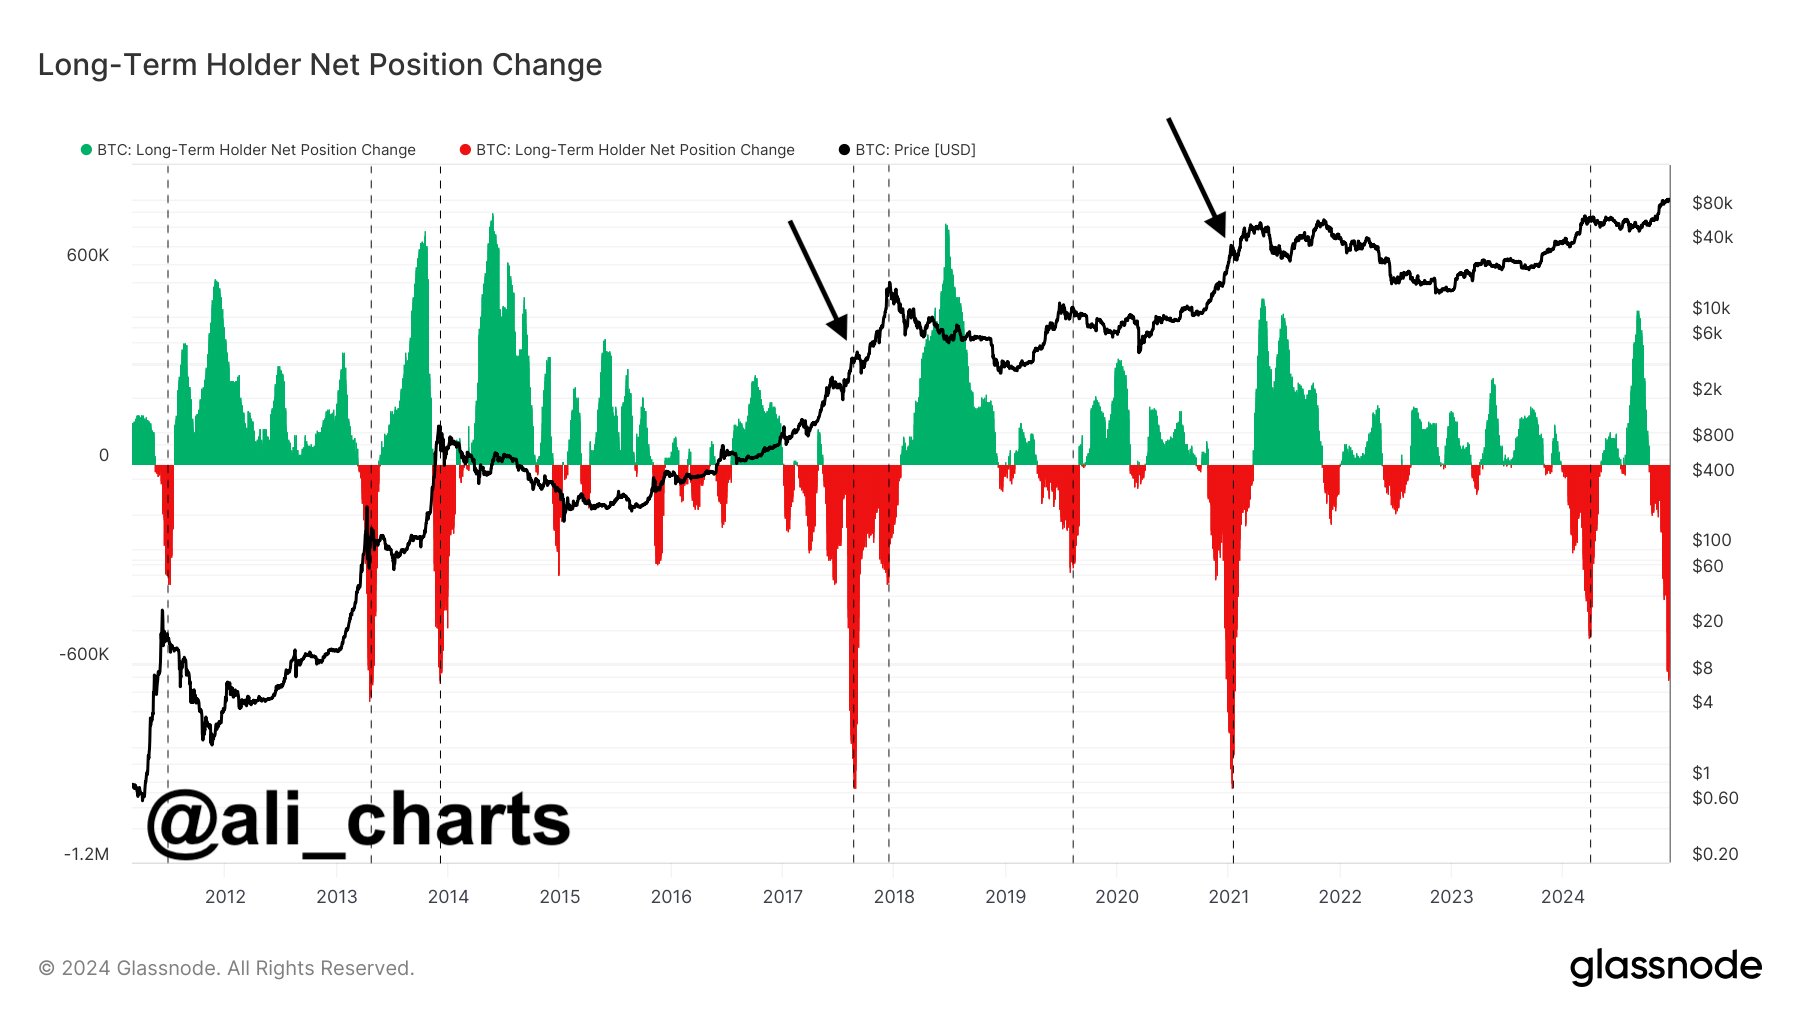
The Net Position Change is an on-chain metric that measures the total amount of Bitcoin entering into or exiting out of the LTH cohort. Below is the chart for the indicator shared by the analyst that shows the trend in its value over the history of the cryptocurrency.

As displayed in the above graph, the Bitcoin LTH Net Position Change has witnessed a sharp decline into the negative territory in recent weeks, which implies a net amount of supply has been leaving the cohort.

This isn’t the first time this year that the indicator has shown this trend, as something similar was also observed back during the first quarter of this year. In the chart, Martinez has highlighted this and the other older instances of this trend occurring.

It would seem that the major selloffs from the LTHs have generally coincided with some sort of top in the cryptocurrency. “Interestingly, in 2017 and 2021, their biggest sell-offs occurred right before the final leg up,” notes the analyst.

Thus, if the current bull market is going to show anything similar, then it’s possible that the current LTH selloff may in fact only be the start of that final leg up that’s going to lead to the cyclical top for Bitcoin.

The indicator is also currently not as negative as during the largest red spikes of the 2017 and 2021 bull runs, which could be another indication that the top isn’t in just yet. It only remains to be seen, though, whether the same pattern would repeat this time as well or not.

BTC Price

Bitcoin is back in all-time high (ATH) discovery mode as its price has just set a new record above the $107,000 milestone.

Bitcoin Price Chart
Credit: Source link

ShareTweetSendPinShare
Previous Post

Global Corporations Eye Bitcoin (BTC) for Asset Reserves Amid Inflation Concerns

Next Post

BitMEX to Launch PENGUUSDT Perpetual Swaps with 50x Leverage

Next Post
Former BitMEX CEO Arthur Hayes Surrenders to US Authorities

BitMEX to Launch PENGUUSDT Perpetual Swaps with 50x Leverage

You might also like

CGV Leads Expansion in Bitcoin Wallet Sector with UniSat Investment

Bitcoin Bottom Predicted at $57K by October 2026: Analyst

April 26, 2026
Ethereum Price Drops Below $2,350, Recovery Hopes Start To Fade

Ethereum Price Drops Below $2,350, Recovery Hopes Start To Fade

April 28, 2026
Bitcoin Faces 5th Rejection At $72,000, Is A Correction Coming?

Bitcoin To $88,000? Analysts Eye May Breakout After Key Close

April 28, 2026
Bitcoin Addresses Holding Between 100 and 10,000 BTC Hit a 7-Week High

Bitcoin Analyst Flags ‘Disbelief Rally’ as Price Hits $77,497

April 26, 2026
Solana Price On The Verge Of A ‘Big Breakout’ — Here’s The Target

Solana Price Ready For A Big Move — Is It Time To Jump In?

April 25, 2026
Bitcoin Price Wave Down To $40K Shows When Bottom Will Begin

Bitcoin Price Wave Down To $40K Shows When Bottom Will Begin

April 26, 2026
CryptoABC.net

This is an Australian online news/education portal that aims to provide the latest crypto news, real-time updates, education and reviews within Australia and around the world. Feel free to get in touch with us!

What's New Here!

Bitcoin Large Players Have Built A Sell Wall At $80.5K–$82K – Spoofing Or Structural Supply?

Bitcoin Large Players Have Built A Sell Wall At $80.5K–$82K – Spoofing Or Structural Supply?

April 29, 2026
A Stealth Force In Derivatives—Why Bitcoin Can’t Punch Past $80,000 Yet

A Stealth Force In Derivatives—Why Bitcoin Can’t Punch Past $80,000 Yet

April 29, 2026

Subscribe Now

  • Contact Us
  • Privacy Policy
  • Terms of Use
  • DMCA

© 2021 cryptoabc.net - All rights reserved!

No Result
View All Result
  • Live Crypto Prices
  • Crypto News
    • Worldwide
      • Bitcoin
      • Ethereum
      • Altcoin
      • Blockchain
      • Regulation
    • Australian Crypto News
  • Education
    • Cryptocurrency For Beginners
    • Where to Buy Cryptocurrency
    • Where to Store Cryptos
    • Cryptocurrency Tax in Australia 2021

© 2021 cryptoabc.net - All rights reserved!

Welcome Back!

Login to your account below

Forgotten Password?

Create New Account!

Fill the forms below to register

All fields are required. Log In

Retrieve your password

Please enter your username or email address to reset your password.

Log In
Please enter CoinGecko Free Api Key to get this plugin works.