


Bitcoin saw a modest retracement yesterday, dipping slightly but continuing to trade within a tight range between key support and resistance levels. While the broader altcoin market faces heightened volatility and notable losses, BTC remains relatively resilient, yet momentum appears uncertain. Analysts warn that if sentiment weakens, a broader correction could unfold.
Related Reading
Top analyst Darkfost highlighted a critical dynamic now unfolding: the vulnerability of Short-Term Holders (STH). These investors, who entered the market during recent price surges, hold Bitcoin at significantly higher cost bases. As price action stalls or retraces, they’re typically the first to capitulate, creating increased selling pressure.
With altcoins already under stress, all eyes remain on whether Bitcoin can hold above current support levels or if it, too, will start to crack under short-term selloffs. This phase could act as a stress test for recent buyers, while long-term holders and institutional participants continue to monitor key price zones.
Key Realized Price Levels Suggest Bitcoin Structure Remains Bullish
Darkfost has shared a chart offering a deep dive into Bitcoin’s realized prices across various holding cohorts, particularly focusing on Short-Term Holders (STHs). These metrics are proving crucial in identifying support zones that could be defended if the price continues to correct in the short term.
The broader realized price for Bitcoin currently stands at $50.8K, while the annual average is significantly higher at $87.5K. More critically, the realized price for STHs—those who purchased coins recently—is positioned at $103.9K. Breaking this down further, we see realized prices by time held:
- STH 3m–6m: $88.2K
- STH 1m–3m: $104.1K
- STH 1w–1m: $113K
These figures represent the average price at which different groups of recent investors acquired their coins. As such, they serve as psychological and technical support levels during corrections.
With Bitcoin currently consolidating after a small retracement, bulls are eyeing these realized price zones to gauge whether the structure remains bullish. The $104K level, in particular, is essential—it aligns closely with the 1m–3m STH realized price and could serve as a decisive line for sentiment and price defense.
If buyers can hold BTC above this level, the market’s bullish structure will likely remain intact, suggesting healthy consolidation rather than trend reversal. Conversely, losing it could trigger short-term panic selling among recent entrants.
Related Reading
Bitcoin Price Analysis: Key Levels Hold After New Highs
Bitcoin continues to consolidate in a tight range after setting fresh all-time highs earlier this month. As seen in the 3-day chart, BTC is holding above $115,724—a key horizontal support—and below immediate resistance near $122,077. This consolidation range has remained intact for over a week, reflecting both strong demand and hesitation near psychological resistance.
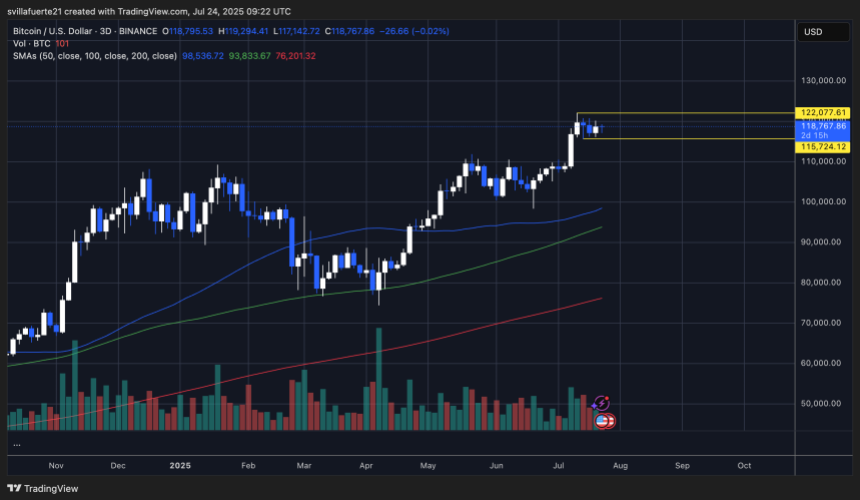
Despite the recent small pullback, the overall market structure remains bullish. Price is trading well above the 50-day ($98,536), 100-day ($93,833), and 200-day ($76,201) simple moving averages, which continue to slope upward. This confirms strong medium- and long-term momentum.
Related Reading
Volume has declined slightly during the current range-bound movement, indicating a pause after the aggressive rally from below $100,000. However, bulls are clearly defending the $115,000–$116,000 region, a zone that coincides with the top of the previous breakout.
Featured image from Dall-E, chart from TradingView
Credit: Source link


