• Live Crypto Prices
  • Crypto News
    • Worldwide
      • Bitcoin
      • Ethereum
      • Altcoin
      • Blockchain
      • Regulation
    • Australian Crypto News
  • Education
    • Cryptocurrency For Beginners
    • Where to Buy Cryptocurrency
    • Where to Store Cryptos
    • Cryptocurrency Tax in Australia 2021
No Result
View All Result
CryptoABC.net
No Result
View All Result

Bitcoin Stablecoin Supply Ratio Now Forms A “Buy” Signal

September 9, 2022
in Bitcoin
Reading Time: 3min read
0 0
A A
0
Bitcoin Stablecoin Supply Ratio Now Forms A “Buy” Signal
0
SHARES
13
VIEWS
ShareShareShareShareShare

On-chain data shows the Bitcoin stablecoin supply ratio is now showing a green signal that has proved to be profitable for the crypto several times in the last two years.

Bitcoin Stablecoin Supply Ratio Shock Momentum Forms “Buy” Signal

As pointed out by an analyst in a CryptoQuant post, out of the 11 previous such buy signals, 10 ended up profitable for the crypto.

The “stablecoin supply ratio” (or the SSR in brief) is an indicator that measures the ratio between the market cap of Bitcoin and that of all stablecoins.

Generally, whenever investors want to avoid volatility associated with cryptos like BTC, they shift their coins into stablecoins. Once they feel that prices are right to re-enter the markets again, they buy back into them. As such, the total stablecoin supply can be looked at as potential buying pressure for other cryptos.

When the value of the SSR is high, it means the BTC supply is higher compared to the stablecoin cap, and thus there is low buying pressure in the market currently.

On the other hand, low values of the indicator suggest there is high potential dry powder in the market right now. Because of this, such a trend can be bullish for the price of Bitcoin.

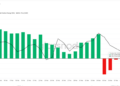
Now, there is a metric called the Bitcoin SSR “shock momentum,” which tracks the rate of change in its value. Here is a chart that shows the trend for it over the past couple of years:

Looks like the value of the metric has been low in recent days | Source: CryptoQuant

As you can see in the above graph, the quant from the post has marked the relevant points of trend for the Bitcoin SSR shock momentum.

It seems like whenever this metric has made a low below the green dotted level, the price of the crypto has observed a buy signal.

During the last two years, there have been eleven instances of this pattern taking place, out of which only one has turned out to be a false signal.

Most recently, the indicator has once again showed this formation. If the past trend is anything to go by, then this may turn out to be bullish for Bitcoin.

BTC Price

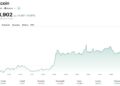
At the time of writing, Bitcoin’s price floats around $20.9k, up 4% in the past week. Over the last month, the crypto has lost 12% in value.

The below chart shows the trend in the BTC price over the last five days.

Bitcoin Price Chart

The value of the crypto seems to have spiked up over the past day | Source: BTCUSD on TradingView
Featured image from Quaritsch Photography on Unsplash.com, charts from TradingView.com, CryptoQuant.com

Credit: Source link

ShareTweetSendPinShare
Previous Post

Major Ethereum (ETH) Competitor Makes Cosmic Leap As Metaverse Tokens ApeCoin, Flow, and Axie Infinity Rally

Next Post

Why The Ethereum Price Could Rally Above $1,800 Before A Big Crash

Next Post
Ethereum Price Faces Sell Off, How Far Is The Correction Going To Go?

Why The Ethereum Price Could Rally Above $1,800 Before A Big Crash

You might also like

BlackRock Signals Cautious Expansion of Crypto ETFs Despite New Staked Ether Fund

BlackRock Signals Cautious Expansion of Crypto ETFs Despite New Staked Ether Fund

March 16, 2026
Why Is Crypto Up: BTC USD Decoupling From Gold Amid Heated Israel-Iran War

Why Is Crypto Up: BTC USD Decoupling From Gold Amid Heated Israel-Iran War

March 16, 2026
Solana Price Prediction: Buying Pressure Just Doubled — Is SOL About to Explode Past $100?

Solana Price Prediction: Buying Pressure Just Doubled — Is SOL About to Explode Past $100?

March 13, 2026
Bitcoin Candlestick Structure That Led To Crash To Below $20,000 Last Cycle Just Appeared Again

Bitcoin Candlestick Structure That Led To Crash To Below $20,000 Last Cycle Just Appeared Again

March 10, 2026
Trump Memecoin Surges Briefly on Promise of Exclusive Mar-a-Lago Event

Trump Memecoin Surges Briefly on Promise of Exclusive Mar-a-Lago Event

March 13, 2026
Bitcoin Just Entered The DCA Zone Again, Why This Is A Good Time To Buy

Bitcoin Just Entered The DCA Zone Again, Why This Is A Good Time To Buy

March 10, 2026
CryptoABC.net

This is an Australian online news/education portal that aims to provide the latest crypto news, real-time updates, education and reviews within Australia and around the world. Feel free to get in touch with us!

What's New Here!

What Price Will This Surge Bring?

Key Indicators Signal Bottom And Major Relief Rally

March 17, 2026
Uniswap (UNI) Price Rallies 6.53% – Is Now the Time to Buy? Comprehensive Analysis & Trading Insights

UNI Price Prediction: Targets $4.18-$4.27 by April as Technical Indicators Show Mixed Signals

March 17, 2026

Subscribe Now

  • Contact Us
  • Privacy Policy
  • Terms of Use
  • DMCA

© 2021 cryptoabc.net - All rights reserved!

No Result
View All Result
  • Live Crypto Prices
  • Crypto News
    • Worldwide
      • Bitcoin
      • Ethereum
      • Altcoin
      • Blockchain
      • Regulation
    • Australian Crypto News
  • Education
    • Cryptocurrency For Beginners
    • Where to Buy Cryptocurrency
    • Where to Store Cryptos
    • Cryptocurrency Tax in Australia 2021

© 2021 cryptoabc.net - All rights reserved!

Welcome Back!

Login to your account below

Forgotten Password?

Create New Account!

Fill the forms below to register

All fields are required. Log In

Retrieve your password

Please enter your username or email address to reset your password.

Log In
Please enter CoinGecko Free Api Key to get this plugin works.