• Live Crypto Prices
  • Crypto News
    • Worldwide
      • Bitcoin
      • Ethereum
      • Altcoin
      • Blockchain
      • Regulation
    • Australian Crypto News
  • Education
    • Cryptocurrency For Beginners
    • Where to Buy Cryptocurrency
    • Where to Store Cryptos
    • Cryptocurrency Tax in Australia 2021
No Result
View All Result
CryptoABC.net
No Result
View All Result

Bitcoin Price Slips Below $19,000, Vital Trading Levels To Look Out For

September 24, 2022
in Bitcoin
Reading Time: 4min read
0 0
A A
0
Bitcoin Price Slips Below $19,000, Vital Trading Levels To Look Out For
0
SHARES
4
VIEWS
ShareShareShareShareShare

The Bitcoin price is now trading below the $19,000 level after the bulls failed to defend the coin at the aforementioned level.

Over the last 24 hours, BTC fell by 1.2%, indicating that the coin was laterally trading. In the past week, the Bitcoin price has depreciated 6%.

Buying strength continued to remain low on the one-day chart. Sellers have taken over, and it has been the same for almost a week.

If the price of Bitcoin continues in this direction, the coin may fall to its immediate support zone.

If the bulls have to defend BTC at the current price level, then buyers have to come through. The current support zone for the coin is $18,500-$18,000.

A fall from that level would cause Bitcoin to travel below $17,000. The asset can drop to $16,000 and then, subsequently, to the $14,000 level. The recent dip in buying strength will cause BTC to dip further on its 24-hour chart.

Bitcoin Price Analysis: One Day Chart

Bitcoin was priced at $18,600 on the one day chart | Source: BTCUSD on TradingView

BTC was trading at $18,600 at the time of writing. The immediate resistance for the coin was at $19,000, and the bulls have failed to defend the coin at that price level for weeks now.

If Bitcoin price manages to surpass the $20,000 level, the bulls might be able to take charge. The nearest support line for the coin was $18,000.

A fall beneath that means BTC touching $16,000 and then $14,000. The amount of Bitcoin traded in the last session decreased, and that meant a fall in buying strength.

Technical Analysis

Bitcoin Price
Bitcoin registered fall in buying strength on the one day chart | Source: BTCUSD on TradingView

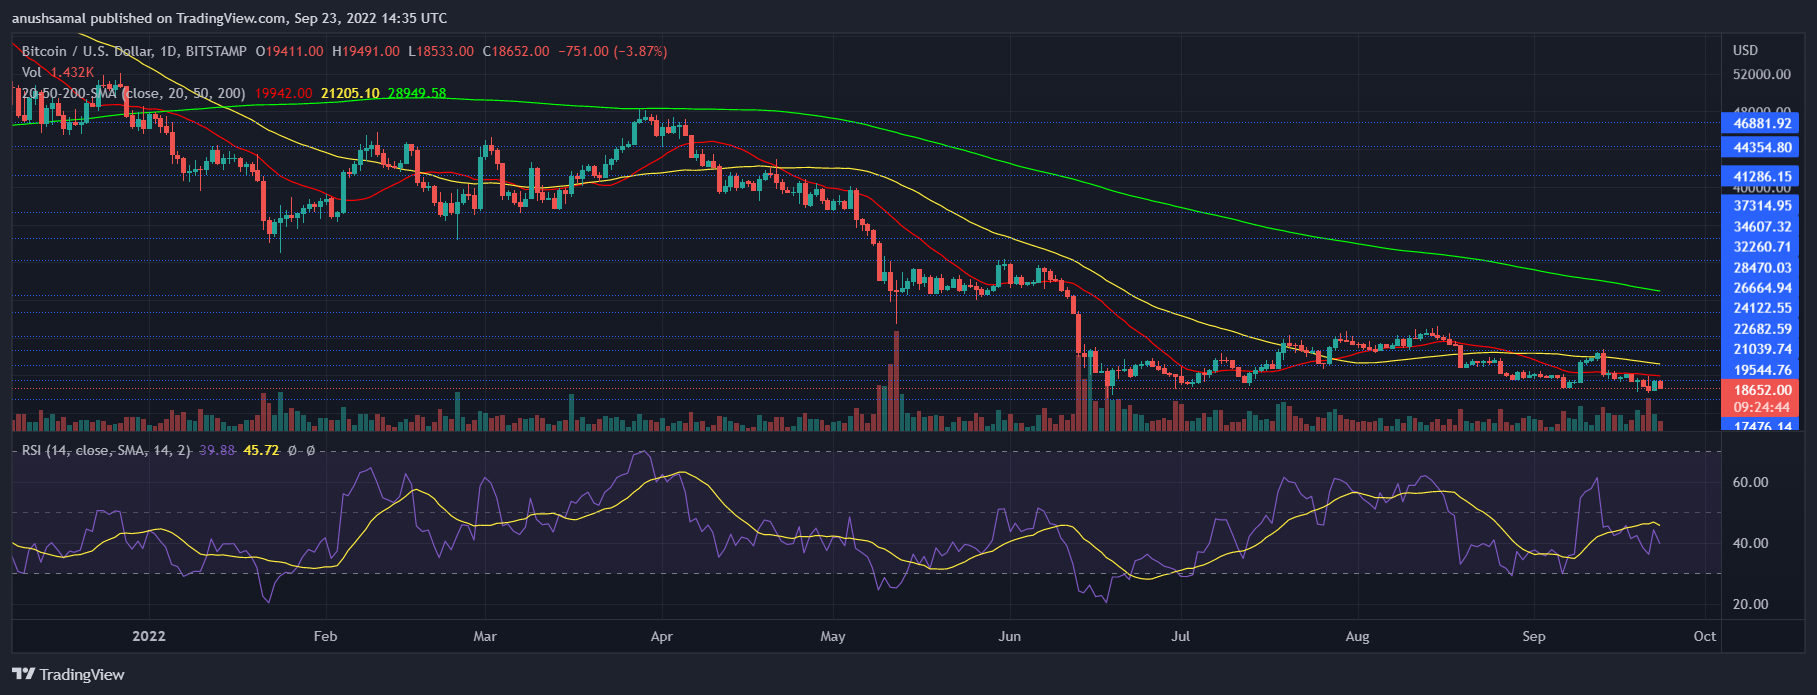
On the one-day chart, BTC showed that there was demand at lower levels. The technical indicators also suggested that sellers outnumbered buyers.

The Relative Strength Index was below the half-line, which indicated increased selling strength.

The Bitcoin price was below the 20-SMA line, and that meant sellers were driving the price momentum in the market as there was decreased demand for Bitcoin on the one-day chart.

Bitcoin Price
Bitcoin depicted sell signal on the one day chart | Source: BTCUSD on TradingView

BTC depicted increased selling pressure, which has been dragging the coin to its closest support line. The technical outlook points towards further selling pressure for the coin.

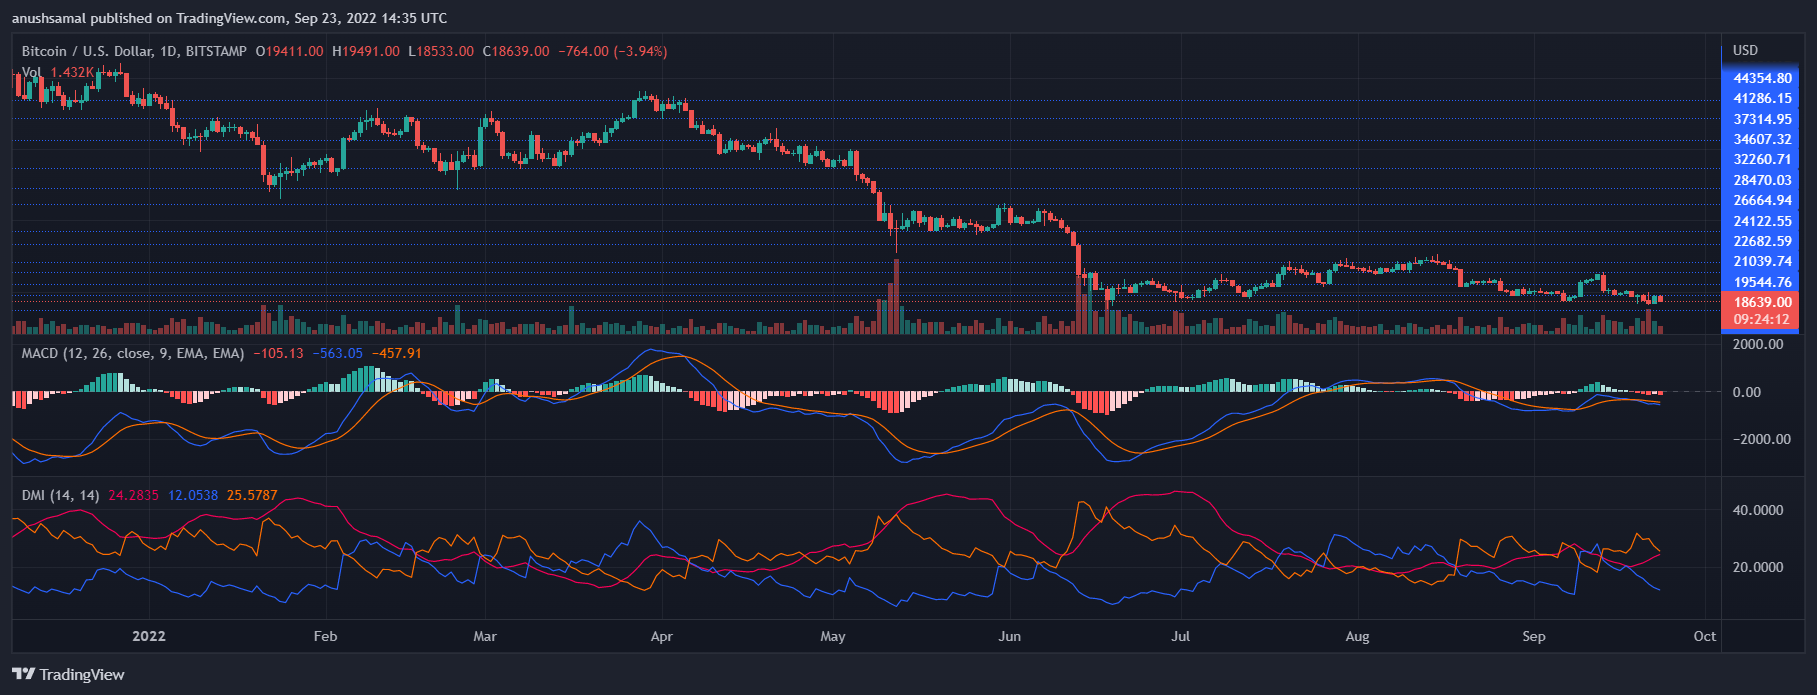
The Moving Average Convergence Divergence indicates the price momentum and the overall price action of the coin.

The MACD underwent a bearish crossover and formed red histograms, which was sell signal for the coin. The Directional Movement Index was negative as the -DI line was above the +DI line and that showed that the bears were in control of the coiin.

The Average Directional Index (Red) was moving above the 20-mark, and that’s a sign of bearish momentum for Bitcoin.

Credit: Source link

ShareTweetSendPinShare
Previous Post

Number Of Bitcoin Addresses Sending BTC To Exchanges Continues To Drop

Next Post

First 3nm ASIC Miners Released by Bitramo

Next Post
First 3nm ASIC Miners Released by Bitramo

First 3nm ASIC Miners Released by Bitramo

You might also like

This Altcoin Gem Will Overtake Solana, Predicts Arthur Hayes

Arthur Hayes Says He Wouldn’t Buy Bitcoin Yet: Wait For This

March 11, 2026
Ethereum Price Rockets Above $2,200 as Bulls Tighten Market Control

Ethereum Price Rockets Above $2,200 as Bulls Tighten Market Control

March 16, 2026
Pundit Shares What The XRP Float Is Likely To Be For Global Settlement

Pundit Shares What The XRP Float Is Likely To Be For Global Settlement

March 13, 2026
Binance WSJ Lawsuit: The Crypto Exchange Sues Wall Street Journal Over ‘Defamatory’ Iran Sanctions Report

Binance WSJ Lawsuit: The Crypto Exchange Sues Wall Street Journal Over ‘Defamatory’ Iran Sanctions Report

March 11, 2026
Vitalik Buterin Says Ethereum’s Core Role May Be Simpler Than the Industry Thinks

Vitalik Buterin Says Ethereum’s Core Role May Be Simpler Than the Industry Thinks

March 13, 2026
Ethereum USD Reclaims $2,200 as the Crypto Market Booms

Ethereum USD Reclaims $2,200 as the Crypto Market Booms

March 16, 2026
CryptoABC.net

This is an Australian online news/education portal that aims to provide the latest crypto news, real-time updates, education and reviews within Australia and around the world. Feel free to get in touch with us!

What's New Here!

XRP Flashes Bottom Signals As Analyst Eyes Breakout To $14–$18

XRP Flashes Bottom Signals As Analyst Eyes Breakout To $14–$18

March 18, 2026
This Signal Has Correctly Predicted The Last 3 Cycle Bottoms

This Signal Has Correctly Predicted The Last 3 Cycle Bottoms

March 18, 2026

Subscribe Now

  • Contact Us
  • Privacy Policy
  • Terms of Use
  • DMCA

© 2021 cryptoabc.net - All rights reserved!

No Result
View All Result
  • Live Crypto Prices
  • Crypto News
    • Worldwide
      • Bitcoin
      • Ethereum
      • Altcoin
      • Blockchain
      • Regulation
    • Australian Crypto News
  • Education
    • Cryptocurrency For Beginners
    • Where to Buy Cryptocurrency
    • Where to Store Cryptos
    • Cryptocurrency Tax in Australia 2021

© 2021 cryptoabc.net - All rights reserved!

Welcome Back!

Login to your account below

Forgotten Password?

Create New Account!

Fill the forms below to register

All fields are required. Log In

Retrieve your password

Please enter your username or email address to reset your password.

Log In
Please enter CoinGecko Free Api Key to get this plugin works.