


Reason to trust
Strict editorial policy that focuses on accuracy, relevance, and impartiality
Created by industry experts and meticulously reviewed
The highest standards in reporting and publishing
Strict editorial policy that focuses on accuracy, relevance, and impartiality
Morbi pretium leo et nisl aliquam mollis. Quisque arcu lorem, ultricies quis pellentesque nec, ullamcorper eu odio.
Este artículo también está disponible en español.
Bitcoin price started a fresh decline below the $80,000 zone. BTC is now correcting losses and might face resistance near the $80,500 zone.
- Bitcoin started a fresh decline below the $80,000 zone.
- The price is trading below $81,500 and the 100 hourly Simple moving average.
- There is a connecting bearish trend line forming with resistance at $80,400 on the hourly chart of the BTC/USD pair (data feed from Kraken).
- The pair could start another increase if it clears the $81,500 zone.
Bitcoin Price Starts Recovery
Bitcoin price started a fresh decline below the $82,000 and $81,200 levels. BTC traded below the $80,500 and $80,000 levels to enter a bearish zone.
The price even dived below the $78,000 support zone. A low was formed at $74,409 and the price started a recovery wave. There was a move above the $76,800 level. The price climbed above the 50% Fib retracement level of the recent decline from the $83,680 swing high to the $74,409 low.
However, the price is struggling to continue higher. Bitcoin price is now trading below $81,200 and the 100 hourly Simple moving average. On the upside, immediate resistance is near the $80,400 level. There is also a connecting bearish trend line forming with resistance at $80,400 on the hourly chart of the BTC/USD pair.
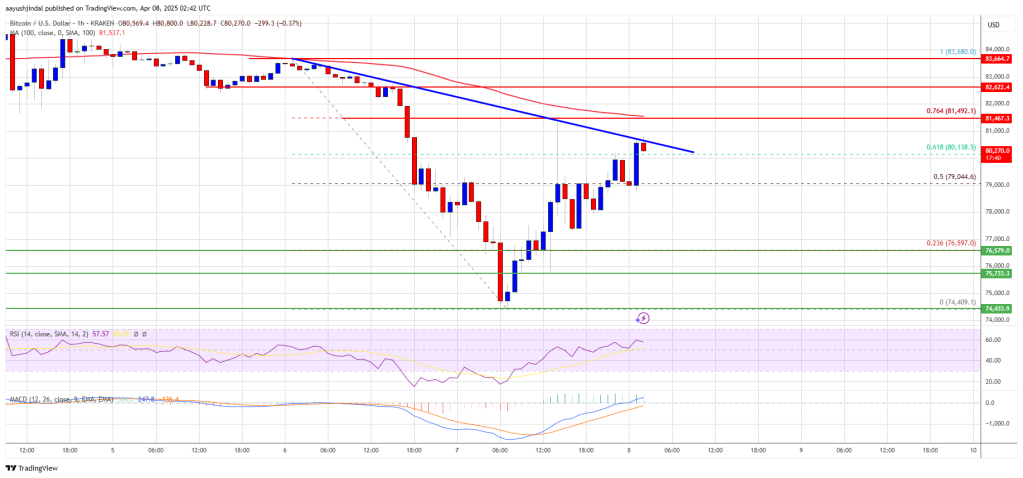
The first key resistance is near the $81,500 level or the 76.4% Fib retracement level of the recent decline from the $83,680 swing high to the $74,409 low. The next key resistance could be $82,500. A close above the $82,500 resistance might send the price further higher. In the stated case, the price could rise and test the $83,500 resistance level. Any more gains might send the price toward the $85,000 level.
Another Decline In BTC?
If Bitcoin fails to rise above the $80,500 resistance zone, it could start a fresh decline. Immediate support on the downside is near the $79,500 level. The first major support is near the $78,000 level.
The next support is now near the $76,500 zone. Any more losses might send the price toward the $75,000 support in the near term. The main support sits at $74,400.
Technical indicators:
Hourly MACD – The MACD is now gaining pace in the bullish zone.
Hourly RSI (Relative Strength Index) – The RSI for BTC/USD is now above the 50 level.
Major Support Levels – $79,500, followed by $78,000.
Major Resistance Levels – $80,500 and $81,500.
Credit: Source link


