• Live Crypto Prices
  • Crypto News
    • Worldwide
      • Bitcoin
      • Ethereum
      • Altcoin
      • Blockchain
      • Regulation
    • Australian Crypto News
  • Education
    • Cryptocurrency For Beginners
    • Where to Buy Cryptocurrency
    • Where to Store Cryptos
    • Cryptocurrency Tax in Australia 2021
No Result
View All Result
CryptoABC.net
No Result
View All Result

Bitcoin Flashes Rare Bottom Signal As Altcoin Market Cap and One More Metric Hint at Trend Reversal: Top Analyst

August 3, 2022
in Altcoin
Reading Time: 3min read
0 0
A A
0
Bitcoin Flashes Rare Bottom Signal As Altcoin Market Cap and One More Metric Hint at Trend Reversal: Top Analyst
0
SHARES
19
VIEWS
ShareShareShareShareShare

A closely followed analyst is highlighting one key historical metric as an indicator that Bitcoin (BTC) may finally have set a bottom after an eight-month-long bear market.

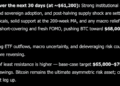
The pseudonymous crypto enthusiast TechDev tells his 399,600 Twitter followers about the significance of 1-year HODL waves, a metric that keeps track of Bitcoin that has remained dormant for over a year. During three prior instances where static BTC peaked in 2012, 2015 and 2019, a rally soon followed.

“1 yr+ HODL wave 200-day rate of change peaks over 0.1.

4 signals in 11 years.”

Source: TechDev/Twitter

At time of writing, Bitcoin is down less than a percent in the past 24 hours and trading for $23,066.

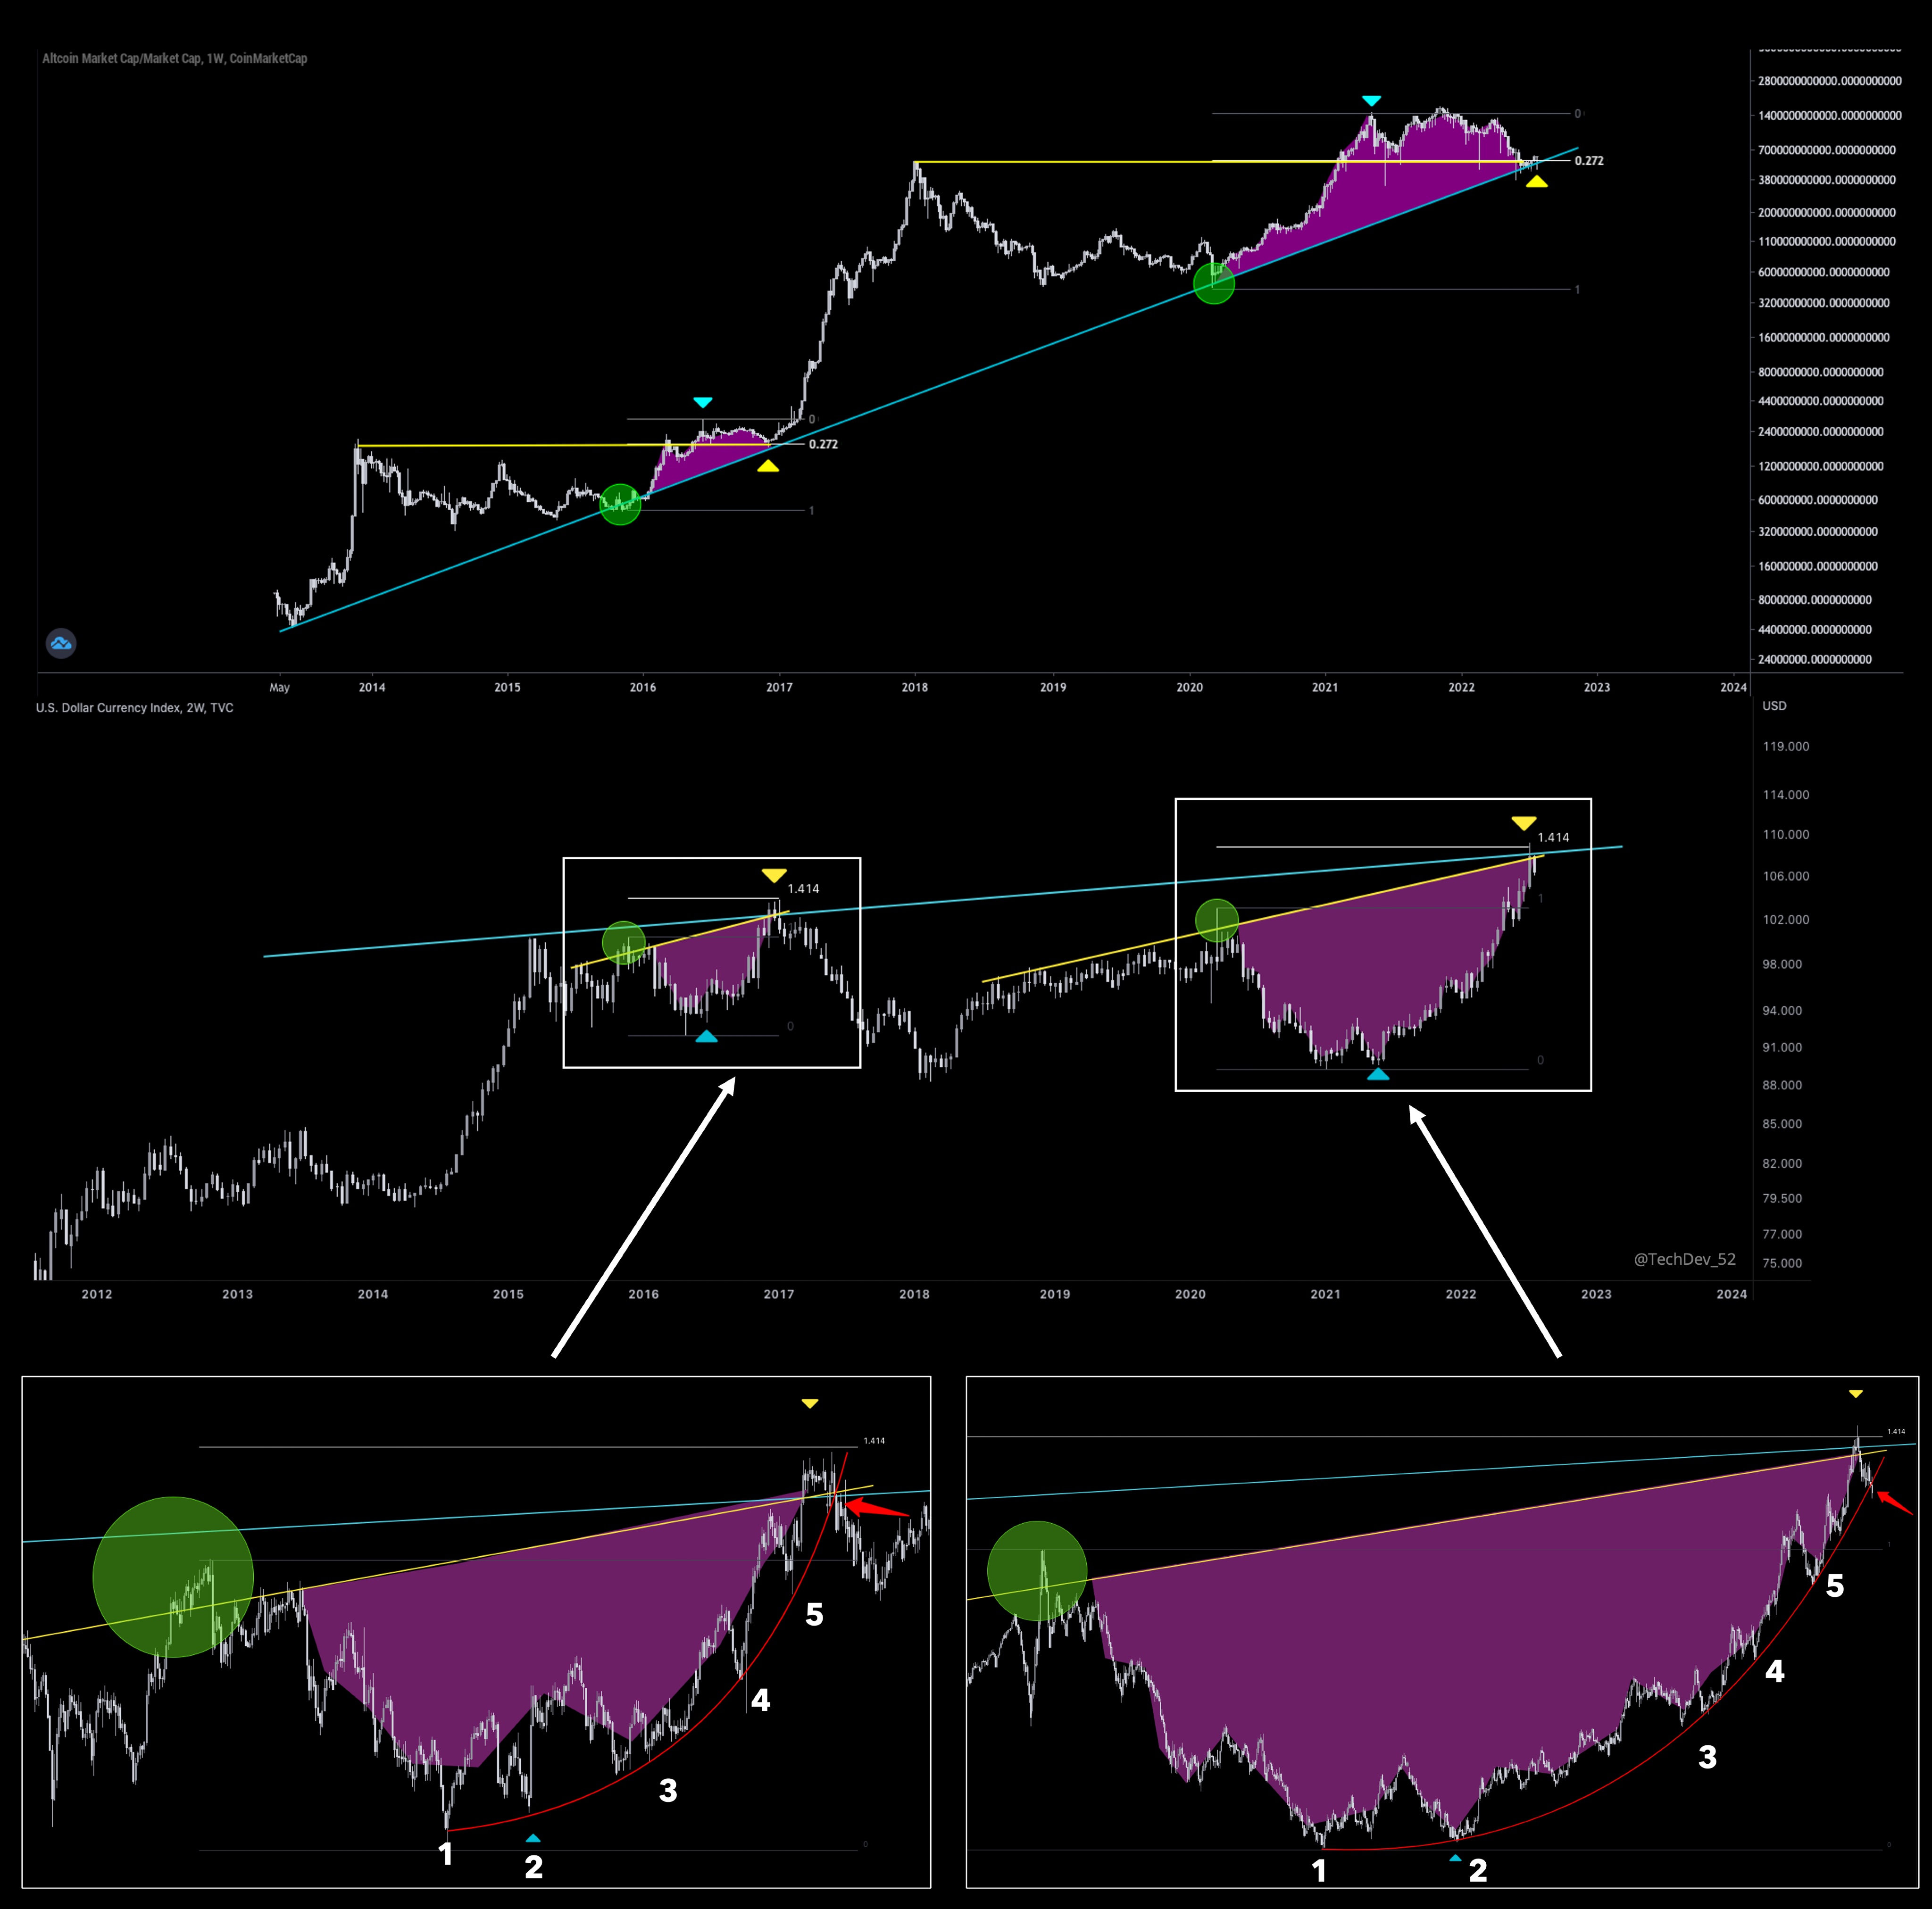
TechDev next looks at how altcoins have performed against the US dollar index (DXY) over nearly a decade while plotting out Fibonacci extensions that suggest altcoins might be primed to move higher if the DXY falters.

“Altcoins bouncing from long-term TL [timeline] + prior ATH [all-time high] + 0.272.

DXY at long-term TL + local TL + 1.414 after parabolic move.

Possible parabola breakdown after 5 touchpoints and 1.414 extension into 2 TLs.

Watching for further confirmation of DXY breakdown and altcoin impulse.”

Image
Source: TechDev/Twitter

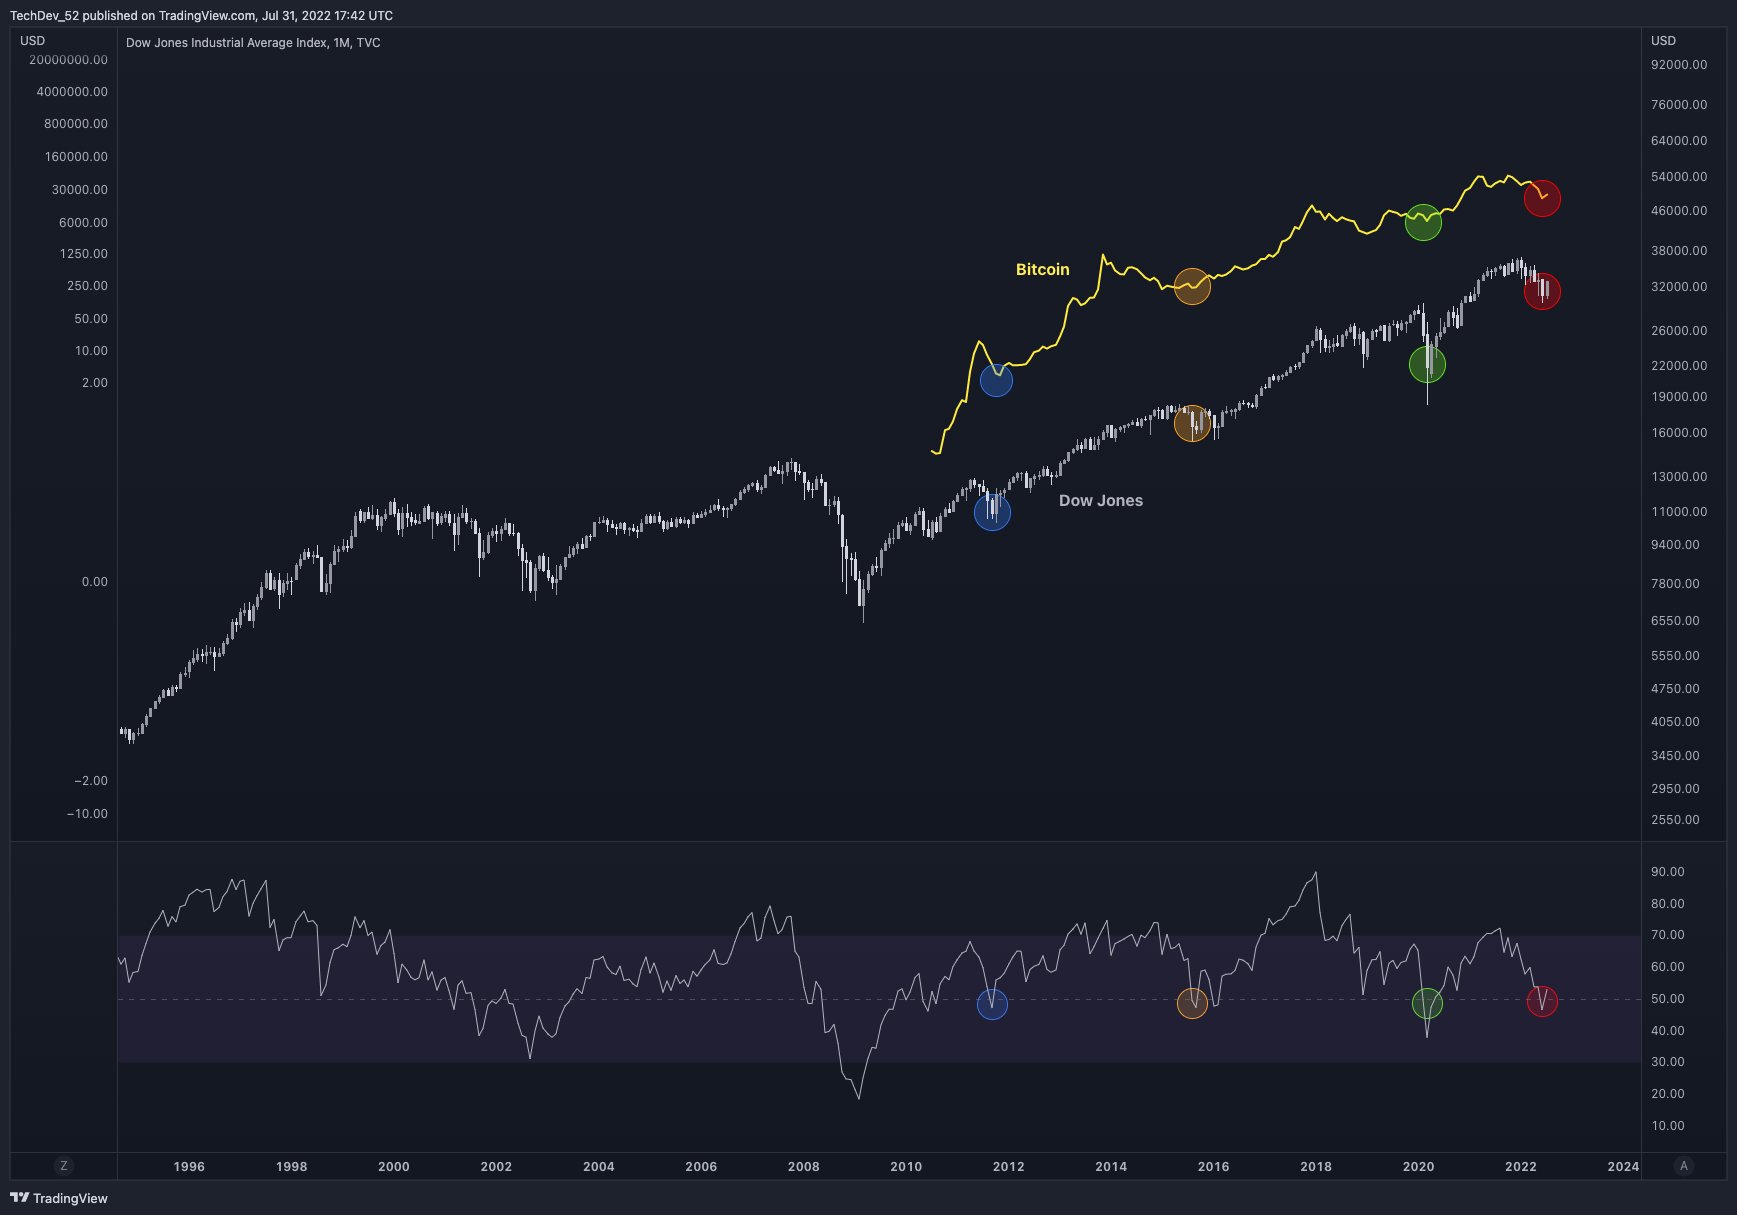
The analyst wraps up by comparing Bitcoin’s relative strength against the top 50 Dow Jones stocks dating back to 2012. The relative strength index (RSI) is an indicator used by traders to gauge the momentum of an asset’s trend, where a falling RSI suggests strong bearish momentum and vice versa.

TechDev provides a chart that shows similar up-and-down price momentum while highlighting key moments in 2012, 2016, 2020 and this year.

“Bitcoin and Dow Jones 50 monthly RSI interactions.”

Image
Source: TechDev/Twitter

Don’t Miss a Beat – Subscribe to get crypto email alerts delivered directly to your inbox

Check Price Action

Follow us on Twitter, Facebook and Telegram

Surf The Daily Hodl Mix

Check Latest News Headlines

&nbsp

Disclaimer: Opinions expressed at The Daily Hodl are not investment advice. Investors should do their due diligence before making any high-risk investments in Bitcoin, cryptocurrency or digital assets. Please be advised that your transfers and trades are at your own risk, and any loses you may incur are your responsibility. The Daily Hodl does not recommend the buying or selling of any cryptocurrencies or digital assets, nor is The Daily Hodl an investment advisor. Please note that The Daily Hodl participates in affiliate marketing.

Featured Image: Shutterstock/BT Side


Credit: Source link

ShareTweetSendPinShare
Previous Post

Trading Platform Forex Suggest to Launch Crypto Calculator for Cost Evaluation

Next Post

Institutions Turned Bullish on Crypto in July with 2022’s Strongest Inflows of $474,000,000: CoinShares

Next Post
Institutions Turned Bullish on Crypto in July with 2022’s Strongest Inflows of $474,000,000: CoinShares

Institutions Turned Bullish on Crypto in July with 2022's Strongest Inflows of $474,000,000: CoinShares

You might also like

Circle CEO Allaire Supports Binance Stablecoin Decision

USDC and Circle’s CCTP Go Live on Pharos Blockchain

April 28, 2026
Bitcoin Hash Ribbons Flash Buy, But This Time Comes With A Catch

Bitcoin Hash Ribbons Flash Buy, But This Time Comes With A Catch

April 29, 2026
Solana (SOL) Edges Up, Traders Watch For Sustained Upside Move

Solana (SOL) Edges Up, Traders Watch For Sustained Upside Move

April 27, 2026
Leading AI Claude Predicts the Price of XRP, Bitcoin and Ethereum by the end of May 2026

Leading AI Claude Predicts the Price of XRP, Bitcoin and Ethereum by the end of May 2026

April 29, 2026
Analyst Who Called Bitcoin’s Top Correctly Now Predicting The Bottom

Analyst Who Called Bitcoin’s Top Correctly Now Predicting The Bottom

April 26, 2026
CGV Leads Expansion in Bitcoin Wallet Sector with UniSat Investment

Prediction Markets Driven by 3.5% of Users, Study Finds

April 27, 2026
CryptoABC.net

This is an Australian online news/education portal that aims to provide the latest crypto news, real-time updates, education and reviews within Australia and around the world. Feel free to get in touch with us!

What's New Here!

Dogecoin Futures Open Interest Explodes As Leveraged Traders Pile In

April 30, 2026
Bitcoin Large Players Have Built A Sell Wall At $80.5K–$82K – Spoofing Or Structural Supply?

Bitcoin Large Players Have Built A Sell Wall At $80.5K–$82K – Spoofing Or Structural Supply?

April 29, 2026

Subscribe Now

  • Contact Us
  • Privacy Policy
  • Terms of Use
  • DMCA

© 2021 cryptoabc.net - All rights reserved!

No Result
View All Result
  • Live Crypto Prices
  • Crypto News
    • Worldwide
      • Bitcoin
      • Ethereum
      • Altcoin
      • Blockchain
      • Regulation
    • Australian Crypto News
  • Education
    • Cryptocurrency For Beginners
    • Where to Buy Cryptocurrency
    • Where to Store Cryptos
    • Cryptocurrency Tax in Australia 2021

© 2021 cryptoabc.net - All rights reserved!

Welcome Back!

Login to your account below

Forgotten Password?

Create New Account!

Fill the forms below to register

All fields are required. Log In

Retrieve your password

Please enter your username or email address to reset your password.

Log In
Please enter CoinGecko Free Api Key to get this plugin works.