


Bitcoin is sitting at a “critical point,” with traders split between two familiar scripts: a full capitulation event, or the early innings of a durable bottoming process. In a Feb. 15 video explainer, CryptoQuant analyst Maartunn argued the data is starting to line up for the latter, but with a clear caveat that any bottom is more likely to be a grind than a snapback.
Is The Bitcoin Bottom In?
Bitcoin is currently trading roughly 50% below its all-time high, a drawdown that looks severe in isolation but still smaller than the 70%+ declines seen in prior bear markets, Maartunn said. The more actionable question, in his framing, is not whether the market can go lower but whether the ingredients that usually precede a turn are appearing.
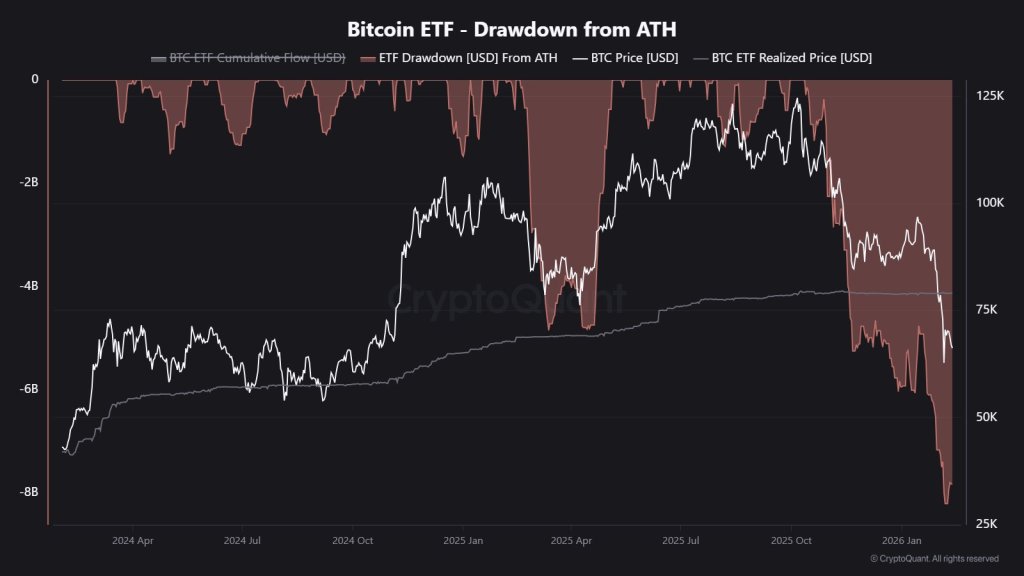
Maartunn points first to what he describes as “structural selling pressure” tied to spot ETFs. According to his figures, the new spot ETFs have posted an $8.2 billion drawdown from peak holdings, “the largest on record”, creating persistent sell pressure. He adds that the current price is around 17% below the average buying price for ETF holders, putting a meaningful slice of that cohort underwater and potentially incentivized to cut exposure.
Related Reading
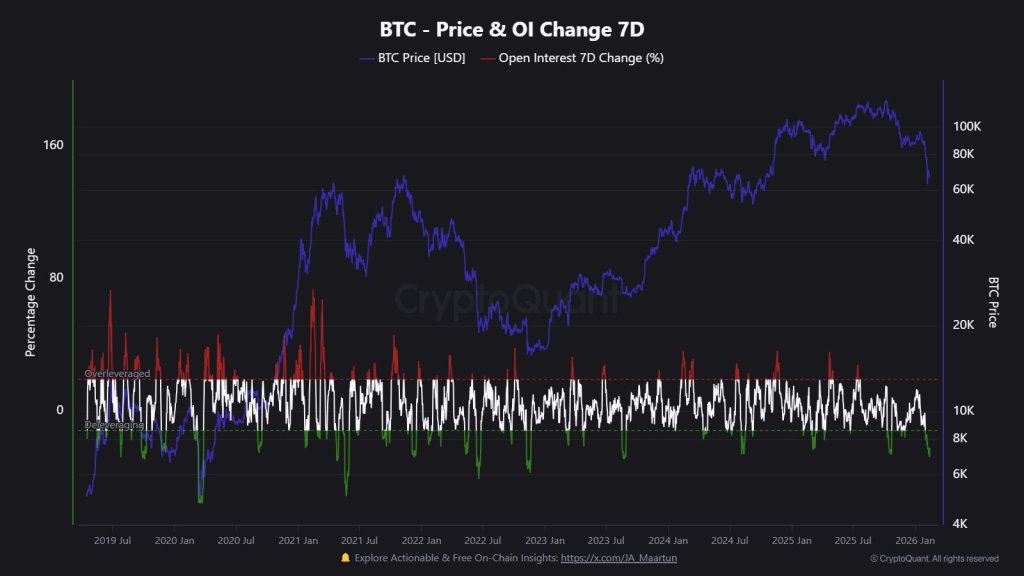
He then pairs that flow story with a mechanical reset in derivatives. Open interest has been “sliced by more than half,” falling from $45.5 billion to $21.7 billion, with a 27% drop in open interest in the last week alone. Maartunn describes this as a broad deleveraging event, painful in real time, but historically consistent with conditions that allow a bottom to form.
“Look, it’s definitely painful for anyone who is overleveraged, but getting rid of all that speculation is an absolutely necessary step to form a real sustainable market bottom,” he said. “This is a signal of a major wash out of speculative excess.”
To gauge whether the drawdown is translating into capitulation-like stress, Maartunn focuses on short-term holders. He cites the short-term holder MVRV ratio at 0.72, implying the average short-term holder is down about 28%, “deep underwater” as a group. In his telling, that’s not a routine reading: it’s the lowest level since the July 2022 bottom, and a band that has historically aligned with periods of maximum financial pain.
“This level of financial stress is pretty rare historically, and it usually happens during periods of major capitulation,” Maartunn said. “Now, sure, could this ratio go even lower? Absolutely. But what history shows us is that when we get down into these levels, the risk-to-reward profile for Bitcoin starts to look a lot better.”
Related Reading
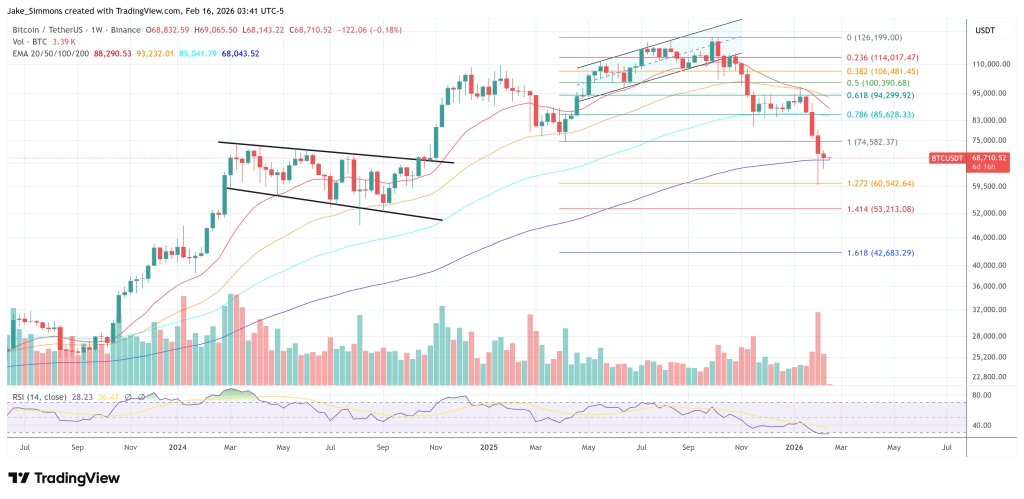
Maartunn also frames the current structure as a retest of a major support cluster — where the previous cycle’s all-time high intersects the upper boundary of an older trading range — a zone that has often mattered in past cycle transitions. From there, he moves to time-based analogs, suggesting prior bear-market durations imply a broad window between June and December 2026, with the last two cycles clustering most tightly between September and November.
His closing point is that bottoms are rarely single-day events. In his view, ETF-driven structural selling, the leverage flush, stress among short-term holders, and the retest of key levels can all coexist inside a longer bottoming process — with sentiment as the final tell.
“A real market bottom… that’s usually marked by just apathy,” he said. “When engagement on social media is totally dead, your timeline is quiet, and honestly, nobody seems to care anymore. That period of total disinterest is often the point of maximum financial opportunity.”
Overall, the implication of Maartunn’s framework is straightforward: the data may be shifting toward early bottom formation signals, but the confirming evidence, particularly around flows and sentiment, could still arrive in stages, with volatility and further stress tests along the way.
At press time, Bitcoin traded at $68,710.
Featured image created with DALL.E, chart from TradingView.com
Credit: Source link


