• Live Crypto Prices
  • Crypto News
    • Worldwide
      • Bitcoin
      • Ethereum
      • Altcoin
      • Blockchain
      • Regulation
    • Australian Crypto News
  • Education
    • Cryptocurrency For Beginners
    • Where to Buy Cryptocurrency
    • Where to Store Cryptos
    • Cryptocurrency Tax in Australia 2021
No Result
View All Result
CryptoABC.net
No Result
View All Result

As Bitcoin Breaks $50k, Indicators Show A Calm Before The Storm

September 2, 2021
in Bitcoin
Reading Time: 4min read
0 0
A A
0
As Bitcoin Breaks $50k, Indicators Show A Calm Before The Storm
0
SHARES
10
VIEWS
ShareShareShareShareShare

As Bitcoin retests the $50k price level, on-chain indicators seem to be aligned so that they suggest the coin might explode upwards soon.

Bitcoin Indicators May Be Showing A Calm Before The Storm

As pointed out by a CryptoQuant post, Bitcoin indicators seem to be showing some interesting values right now. Some of these even look similar to the build up to the late 2020/early 2021 rally that lead to the all-time-high (ATH).

Here is a quick explanation (along with the data) of the three relevant metrics the chart talks about:

The transactions count indicator shows the average number of transactions happening per block on the Bitcoin network. The below chart showcases how its value has changed recently:

The BTC transactions count seems to be going up | Source: Blockchain.com

As the above graph shows, the value of the metric has shot up recently. This is usually a positive sign for an upside.

Related Reading | Mid-Cap Altcoins Crushed Bitcoin And Ethereum In August

The second metric, the mean tokens transferred, shows the average amount of coins transferred on the BTC chain. And the last one, the transaction fees, is pretty self-explanatory. Here is a chart explaining the trends in these indicators:

Bitcoin Indicators

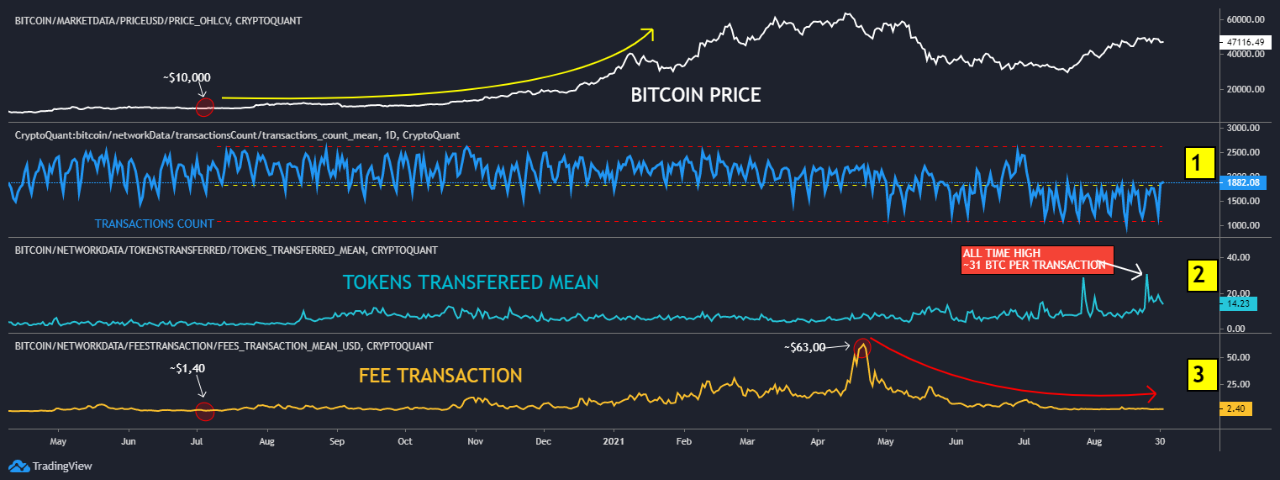
The various Bitcoin chain metrics | Source: CryptoQuant 

Looking at the graph, two things appear clear. The mean tokens transferred indicator hit a new ATH of 31 BTC recently. While the transaction fees seems to have gone down and flattened in the past couple of months.

Related Reading | Why So Bearish? Fidelity Suggests Bitcoin Price Could Rise To $100 Million

Also, as the chart shows, these two trends look similar to how they did during the lead up to the bull rally that helped BTC make a new ATH.

If there is any pattern here, it looks like this might be the calm before the storm as Bitcoin could make large moves upwards soon. The fact that the crypto has shot up and broken $50k quickly might already support this.

BTC Price

At the time of writing, Bitcoin’s price is around $50k, up 6% in the last 7 days. Monthly gains for the cryptocurrency are around 30%.

Here is a chart that shows how the value of the coin has changed over the last three months:

Bitcoin Price Chart

BTC's price gains sudden upwards trend | Source: BTCUSD on TradingView

Over the past few days, it looked as though Bitcoin’s downtrend would continue for a while at least, but today the coin’s price sharply spiked up as it finally retested $50k again.

It remains to be seen if the crypto can keep the momentum up, but if the above indicators are anything to go by, signs seem to be bullish for BTC in the long term.

Featured image from Unsplash.com, charts from TradingView.com, CryptoQuant.com, Blockchain.com

Credit: Source link

ShareTweetSendPinShare
Previous Post

More US Crypto Investors To Hodl Than Eye Short-Term Profit

Next Post

Dogecoin Foundation Denounces Doge-Themed Coin That’s Just Surged by Triple Digits

Next Post
Dogecoin Foundation Denounces Doge-Themed Coin That’s Just Surged by Triple Digits

Dogecoin Foundation Denounces Doge-Themed Coin That’s Just Surged by Triple Digits

You might also like

BNB Chain Launches Zero-Knowledge Proof Scaling Tech

BNB Chain Expands Role in $1.6B Tokenized Equities Market

June 2, 2026
Why RLUSD Will Make XRP More Valuable, Not Less

Why RLUSD Will Make XRP More Valuable, Not Less

June 2, 2026
XRP Long-Awaited Wave Structure Finally Unfolds – What Comes Next?

XRP Long-Awaited Wave Structure Finally Unfolds – What Comes Next?

June 5, 2026
Here’s How High The Bitcoin Price Will Climb If It Breaks The Current Bear Trend

Here’s How High The Bitcoin Price Will Climb If It Breaks The Current Bear Trend

June 5, 2026
Strange New Chinese AI ‘KIMI’ Predicts the Price of Bitcoin by the End of 2026

Strange New Chinese AI ‘KIMI’ Predicts the Price of Bitcoin by the End of 2026

June 3, 2026
$617M Long Liquidation Sparks Bitcoin Rebound, Traders Eye $70K Relief Rally

$617M Long Liquidation Sparks Bitcoin Rebound, Traders Eye $70K Relief Rally

June 5, 2026
CryptoABC.net

This is an Australian online news/education portal that aims to provide the latest crypto news, real-time updates, education and reviews within Australia and around the world. Feel free to get in touch with us!

What's New Here!

Bitcoin Price Crashes To $59K, Sparking Fears Of Deeper Decline

June 7, 2026
Bitcoin CVDD Data Points To Possible Bottom Amid Market Mayhem

Bitcoin CVDD Data Points To Possible Bottom Amid Market Mayhem

June 7, 2026

Subscribe Now

  • Contact Us
  • Privacy Policy
  • Terms of Use
  • DMCA

© 2021 cryptoabc.net - All rights reserved!

No Result
View All Result
  • Live Crypto Prices
  • Crypto News
    • Worldwide
      • Bitcoin
      • Ethereum
      • Altcoin
      • Blockchain
      • Regulation
    • Australian Crypto News
  • Education
    • Cryptocurrency For Beginners
    • Where to Buy Cryptocurrency
    • Where to Store Cryptos
    • Cryptocurrency Tax in Australia 2021

© 2021 cryptoabc.net - All rights reserved!

Welcome Back!

Login to your account below

Forgotten Password?

Create New Account!

Fill the forms below to register

All fields are required. Log In

Retrieve your password

Please enter your username or email address to reset your password.

Log In
Please enter CoinGecko Free Api Key to get this plugin works.