• Live Crypto Prices
  • Crypto News
    • Worldwide
      • Bitcoin
      • Ethereum
      • Altcoin
      • Blockchain
      • Regulation
    • Australian Crypto News
  • Education
    • Cryptocurrency For Beginners
    • Where to Buy Cryptocurrency
    • Where to Store Cryptos
    • Cryptocurrency Tax in Australia 2021
No Result
View All Result
CryptoABC.net
No Result
View All Result

Analyst Who Correctly Predicted The Fantom Breakout Above $1 Reveals What’s Next In The Parabolic Trend

December 18, 2024
in Bitcoin
Reading Time: 4min read
0 0
A A
0
Analyst Who Correctly Predicted The Fantom Breakout Above $1 Reveals What’s Next In The Parabolic Trend
0
SHARES
5
VIEWS
ShareShareShareShareShare

Este artículo también está disponible en español.

A crypto analyst on TradingView, known as ‘Tradecitypro,’ has published a detailed Fantom (FTM) report, breaking down the cryptocurrency’s price action across the daily and 4-hour timeframe. After accurately predicting Fantom‘s surge above $1, the analyst highlights key price levels, market trends, potential price movements, and bullish technical indicators for FTM’s next parabolic trend. 

Fantom Daily Timeframe: Signs Of Trend Weakness

After correctly forecasting FTM’s price breakout at $0.84, the TradingView analyst has revealed that the cryptocurrency is now following a parabolic uptrend, supported by a curved ascending trendline. According to the analyst, Fantom’s price has reacted multiple times to this distinctive trendline, ending price corrections and resuming its upward momentum.  

During the last bullish surge during Fantom’s uptrend, the cryptocurrency broke past the 0.7707 resistance and rose to the weekly resistance zone at 1.1116, where it stabilized above that level. Moreover, several indicators suggest that FTM may be slowing down and losing momentum. Its candle sizes have been gradually shrinking, indicating reduced bullish activity. Additionally, price corrections have intensified, signaling increased selling pressures and potential profit-taking.

Source: TradingView

Fantom’s trading volume has also declined, suggesting that traders’ interests might shift. Another technical indicator that is currently bearish is the Relative Strength Index (RSI), which is showing signs of divergence, signaling a potential reversal of the price of FTM drops below 55.74 on the RSI. 

Looking ahead, the TradingView analyst has revealed that a notable sign of sharp bullish trends and pre-pump movements is when a cryptocurrency exhibits weakness and a potential for a price reversal. If the current bearish trend for Fantom continues, the analyst has set the first minor resistance level at 1.6218. 

Additionally, if FTM can maintain a stable price above this zone, its next and strongest resistance could be at 3.2506. This resistance zone is near FTM’s all-time high of $3.46, representing a significant supply region.

On the other hand, if FTM experiences a price correction, it would likely drop to the first support at the curved trendline. If the trendline is broken, the next price levels to watch are 1.1116 and 0.7707. A sustained price decline below 0.7707 would invalidate the previous bullish scenario for Fantom, potentially pushing the price further down to between 0.5349 and 0.2928. 

4-Hour Timeframe: Ascending Channel And Potential Breakouts

In the 4-hour timeframe, the TradingView analyst revealed that Fantom is currently moving within an Ascending Channel. The cryptocurrency’s price is interacting with the midline of the channel, providing temporary support. 

Fantom 2
Source: TradingView

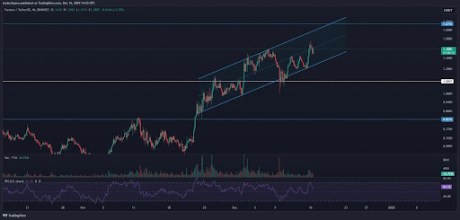
The analyst has revealed that no significant moves will be expected if Fantom remains within this Ascending channel. However, if the cryptocurrency can break out, it could lead to two potential scenarios: the start of a new parabolic trend or a trend exhaustion due to a loss in bullish momentum.

The TradingView analyst has identified the price level at 1.636 as Fantom’s next static resistance. However, if FTM’s price has not yet reached this zone, the analyst suggests a safer strategy of taking long positions based on Dow Theory and channel breakouts.

Fantom FTM price chart from Tradingview.com
FTM bulls still maintaining control | Source: FTMUSDT on Tradingview.com


Featured image created with Dall.E, chart from Tradingview.com

Credit: Source link

ShareTweetSendPinShare
Previous Post

Solana Monthly Chart ‘Looks Ready For A Monster Run’ – Details

Next Post

This Crypto Project Currently ‘Flying Under the Radar’ Could Overtake Chainlink Someday, Says Guy Turner

Next Post
This Crypto Project Currently ‘Flying Under the Radar’ Could Overtake Chainlink Someday, Says Guy Turner

This Crypto Project Currently ‘Flying Under the Radar’ Could Overtake Chainlink Someday, Says Guy Turner

You might also like

Crypto Price Prediction Today 4 March – XRP, Bitcoin, Ethereum

Crypto Price Prediction Today 4 March – XRP, Bitcoin, Ethereum

March 4, 2026
Bitcoin Price and Stocks Stabilize as Bond Market Signals Ongoing Macro Risk

Bitcoin Price and Stocks Stabilize as Bond Market Signals Ongoing Macro Risk

March 6, 2026
Bitcoin Exchange Reserves Fall To 2019 Levels As ETFs And Corporate Treasuries Accumulate

Bitcoin Exchange Reserves Fall To 2019 Levels As ETFs And Corporate Treasuries Accumulate

March 10, 2026
Understanding the Role and Capabilities of AI Agents

LangChain Skills Boost Claude Code Performance From 17% to 92% on AI Tasks

March 4, 2026
Bitcoin Price Prediction: Florida’s Crypto Bill and $198B U.S. Surplus Boost Market Outlook

Bitcoin Price Prediction: Oil Just Exploded 20% — Is BTC About to Crash?

March 10, 2026
Bitcoin Bear Market Could Be Shrinking, But Are We Watching History Repeating Itself?

Bitcoin Bear Market Could Be Shrinking, But Are We Watching History Repeating Itself?

March 8, 2026
CryptoABC.net

This is an Australian online news/education portal that aims to provide the latest crypto news, real-time updates, education and reviews within Australia and around the world. Feel free to get in touch with us!

What's New Here!

Binance WSJ Lawsuit: The Crypto Exchange Sues Wall Street Journal Over ‘Defamatory’ Iran Sanctions Report

Binance WSJ Lawsuit: The Crypto Exchange Sues Wall Street Journal Over ‘Defamatory’ Iran Sanctions Report

March 11, 2026
Binance Withdrawals Jump, ETF Demand Grows

Binance Withdrawals Jump, ETF Demand Grows

March 11, 2026

Subscribe Now

  • Contact Us
  • Privacy Policy
  • Terms of Use
  • DMCA

© 2021 cryptoabc.net - All rights reserved!

No Result
View All Result
  • Live Crypto Prices
  • Crypto News
    • Worldwide
      • Bitcoin
      • Ethereum
      • Altcoin
      • Blockchain
      • Regulation
    • Australian Crypto News
  • Education
    • Cryptocurrency For Beginners
    • Where to Buy Cryptocurrency
    • Where to Store Cryptos
    • Cryptocurrency Tax in Australia 2021

© 2021 cryptoabc.net - All rights reserved!

Welcome Back!

Login to your account below

Forgotten Password?

Create New Account!

Fill the forms below to register

All fields are required. Log In

Retrieve your password

Please enter your username or email address to reset your password.

Log In
Please enter CoinGecko Free Api Key to get this plugin works.