


XRP has slipped below the $1.90 level as selling pressure continues to weigh on the market, reinforcing a cautious tone across recent price action. Attempts at short-term stabilization have so far lacked follow-through, and momentum remains fragile as traders respond to weakening structure rather than clear directional signals. The move below $1.90 places XRP back into a zone where downside risk is being reassessed, particularly in the absence of strong demand on rebounds.
Related Reading
A recent report from CryptoQuant provides context for this behavior, pointing to a market stuck in what it describes as a state of cautious equilibrium. According to Binance data, XRP is currently trading around $1.89, while the 200-day moving average sits near $2.54. This leaves price roughly 25% below its long-term trend reference, a gap that clearly signals ongoing structural weakness rather than a confirmed recovery.
Historically, sustained bullish phases tend to develop only after price reclaims and holds above the 200-day average. XRP’s continued distance from that level suggests the market is still operating within a corrective range, where rallies are more likely to be sold than extended. While short-term recovery attempts are visible, they remain limited in scope and conviction.
The report explains that XRP’s current price action is best understood through a risk-adjusted lens rather than raw price movement. From this perspective, the 30-day Sharpe Ratio sits at just 0.034, a level close to zero. This indicates that over the past month, returns have provided minimal compensation for the risk assumed, a hallmark of markets lacking clear directional conviction.
These conditions typically signal a consolidation phase, where volatility compresses, and traders become more selective, making price increasingly sensitive to shifts in liquidity rather than momentum.
At the same time, the Sharpe Z-Score has turned positive at approximately 0.70, suggesting a relative improvement in return quality compared with XRP’s recent historical average. However, this reading remains well below the threshold generally associated with statistically significant trend formation. In practical terms, this implies that while selling pressure has eased from prior extremes, the market has not yet transitioned into a regime of strong risk-adjusted performance.
Short-term dynamics reinforce this cautious view. The 7-day Sharpe Momentum stands near 0.03, reflecting weak but positive momentum. Although this keeps the indicator marginally above zero, the low magnitude points to gradual base-building rather than impulsive buying.
Taken together, these metrics describe a market in balance—no longer under aggressive pressure, but still lacking the conviction and return profile typically seen at the start of sustained uptrends.
Related Reading
XRP Remains Below Key Moving Averages
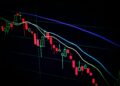
XRP price action continues to reflect a market stuck in a corrective and defensive phase. On the daily chart, XRP is trading near $1.87–$1.90, failing to hold recent rebound attempts and remaining firmly below all major moving averages.

The 50-day moving average (blue) is trending downward and acting as dynamic resistance, while the 100-day (green) and 200-day (red) averages remain well above price, reinforcing the broader bearish structure. With XRP trading roughly 25% below the 200-day MA, the long-term trend has not yet reset into a bullish regime.
Related Reading
Structurally, the chart shows a clear sequence of lower highs and lower lows since the October breakdown, confirming sustained selling pressure. The sharp vertical drop in early October marked a decisive trend shift, after which the price has consolidated in a descending range rather than forming a reversal base. Recent attempts to reclaim the $2.10–$2.20 failed quickly. Suggesting weak follow-through from buyers.
Selling spikes during downside moves remains more pronounced than buying volume during rebounds, pointing to defensive positioning rather than accumulation.
As long as XRP holds below the 50-day and fails to reclaim the $2.20–$2.30 zone, price behavior is more consistent with distribution and consolidation, not trend recovery.
Featured image from ChatGPT, chart from TradingView.com
Credit: Source link


