


Bitcoin has pushed back above the $92,000 level after spending several days trapped below $90,000, offering a brief sense of relief to a market that has remained under pressure since late 2025. The rebound has helped stabilize short-term sentiment, but confidence remains fragile. Many analysts continue to warn that 2026 could evolve into a broader bear market, citing weak spot demand, fading momentum, and persistent sell-side activity from larger participants.
Related Reading
Against this backdrop, macro headlines have re-entered the conversation. An analysis from XWIN Research Japan points to reports of a potential US military intervention in Venezuela, which have revived geopolitical risk concerns across global markets. Historically, such developments tend to increase volatility and push investors toward defensive positioning.
However, Bitcoin’s reaction cannot be judged by price alone, particularly in an environment dominated by derivatives and algorithmic flows.
On-chain behavior offers a more precise lens. Exchange Netflow data is especially relevant during periods of geopolitical stress, as it reflects whether holders are preparing to sell or choosing to stay sidelined. When fear dominates, exchange inflows typically surge as participants move coins onto platforms.
Conversely, muted inflows or continued outflows suggest that investors are not rushing to reduce exposure, even amid unsettling headlines.
Exchange Netflows Suggest Caution, Not Panic
The analysis places the current geopolitical headlines into a broader historical context. During past military conflicts—most notably Russia’s invasion of Ukraine and more recent flare-ups in the Middle East—Bitcoin often experienced sharp but short-lived price volatility.
However, on-chain data told a calmer story. Exchange Netflow, which captures whether coins are being moved onto exchanges to sell or withdrawn for holding, rarely deteriorated in a sustained way during those events. Since 2023, the market has shown a growing ability to absorb localized geopolitical shocks without triggering widespread liquidation behavior.
The situation surrounding Venezuela appears consistent with that pattern. While headlines have introduced uncertainty and contributed to short-term price sensitivity, there is no meaningful surge of Bitcoin moving onto exchanges. The absence of elevated inflows suggests that investors are not reacting with panic. Instead, the market seems to be monitoring developments while maintaining existing exposure.
Historically, Bitcoin’s more pronounced on-chain reactions have been tied to structural economic threats rather than isolated military actions. Events such as US–China trade tensions, aggressive regulatory shifts, or capital control measures tend to impact global liquidity and investor freedom more directly, leaving clearer footprints in exchange flows.
At this stage, the Venezuela narrative has not crossed into that category. Exchange Netflow behavior indicates a market on alert, but not in retreat.
Related Reading
Bitcoin Tests Key Resistance After Relief Rally
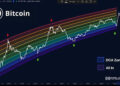
Bitcoin has staged a notable rebound, reclaiming the $92,000 level after spending several days struggling below $90,000. On the chart, this move stands out as a relief rally following a sharp breakdown from the $105,000–$110,000 region earlier in Q4. However, the broader structure still reflects a market in consolidation rather than a confirmed trend reversal.

Price is currently trading below the declining short-term moving average (blue), which has acted as dynamic resistance since the November sell-off. While BTC has managed to reclaim ground above the 200-day moving average (red), this level is still relatively flat, signaling stabilization rather than renewed bullish momentum. The medium-term moving average (green) around the $100,000 area remains a critical barrier that bulls have not yet challenged meaningfully.
Related Reading
The recent bounce occurred with moderate participation, lacking the expansion typically associated with strong trend continuation. This suggests short covering and tactical buying rather than broad-based demand returning to the market.
Structurally, Bitcoin appears to be forming a range between roughly $88,000 and $96,000. Holding above the lower bound would keep the consolidation intact, while a failure back below $88,000 would reopen downside risk toward the mid-$80,000s.
For now, the price action reflects relief and stabilization, but confirmation of a sustainable uptrend still requires a decisive reclaim of higher resistance levels.
Featured image from ChatGPT, chart from TradingView.com
Credit: Source link


