Peter Zhang
Dec 25, 2025 12:29
HBAR price prediction shows modest upside to $0.1160 in the next 24-48 hours, with Hedera forecast suggesting limited momentum as price trades near critical support.

HBAR Price Prediction Summary
• HBAR short-term target (1 week): $0.1160 (+5.45% from current $0.11)
• Hedera medium-term forecast (1 month): $0.1145-$0.14 range with high volatility expected
• Key level to break for bullish continuation: $0.12 (SMA 20 resistance)
• Critical support if bearish: $0.10 (Bollinger Band lower bound and strong support)
Recent Hedera Price Predictions from Analysts
The latest HBAR price prediction consensus from major platforms shows cautiously optimistic targets for the immediate term. Bitget’s analysis projects HBAR price target of $0.1145 by December 25, 2025, based on a conservative daily growth rate of 0.014%. Meanwhile, Blockchain.News offers a slightly more bullish Hedera forecast with a target of $0.1160 by December 26, 2025.
The most significant divergence appears in long-term projections, with Coinbase’s HBAR price prediction extending to $0.14 by 2026, suggesting a gradual 27% appreciation over the next year. This consensus indicates that while analysts expect modest short-term gains, the overall sentiment remains cautiously optimistic rather than aggressively bullish.
What’s notable is the tight clustering of short-term predictions between $0.1145-$0.1160, suggesting limited volatility expectations despite HBAR’s historical price swings.
HBAR Technical Analysis: Setting Up for Cautious Recovery
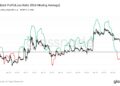
The Hedera technical analysis reveals a mixed picture with several concerning signals that temper bullish expectations. HBAR currently trades at $0.11, precisely at the pivot point level, indicating a critical decision zone for the token’s next directional move.
The RSI reading of 36.38 sits in neutral territory but leans toward oversold conditions, which typically suggests potential for a bounce. However, this is contradicted by the moving average structure, where HBAR trades significantly below all major moving averages – 8% below the SMA 20 ($0.12), 27% below SMA 50 ($0.14), and a concerning 42% below the SMA 200 ($0.19).
The MACD histogram showing a positive 0.0005 reading provides the only clear bullish signal, suggesting that downward momentum is beginning to slow. The Bollinger Bands position at 0.2879 indicates HBAR is trading in the lower portion of its recent range, which historically has provided support for rebounds.
Trading volume of $6.65 million on Binance represents moderate activity but lacks the conviction needed for a strong directional move.
Hedera Price Targets: Bull and Bear Scenarios
Bullish Case for HBAR
The primary HBAR price target in a bullish scenario is $0.1160, representing a 5.45% gain that aligns with analyst consensus. This target is technically justified by the distance to the next Fibonacci retracement level and recent resistance points.
For this scenario to unfold, HBAR needs to break above the immediate resistance at $0.12 (SMA 20) with sustained volume. A successful break would likely target the Bollinger Band upper bound at $0.14, which coincides with the SMA 50 and represents a logical profit-taking zone for short-term traders.
The bullish case is supported by the oversold RSI conditions and the positive MACD histogram, suggesting that selling pressure is diminishing.
Bearish Risk for Hedera
The downside Hedera forecast presents significant risk if the $0.11 pivot point fails to hold. The immediate target in a bearish scenario would be $0.10, which represents both the Bollinger Band lower bound and the 52-week low support level.
A break below $0.10 would be particularly concerning as it would establish new lows and potentially trigger additional selling pressure. The fact that HBAR trades 61.94% below its 52-week high of $0.29 indicates substantial weakness that could continue if broader market conditions deteriorate.
Risk factors include the overall weak positioning below all moving averages and the potential for volume to decrease during the holiday period, which could amplify any negative moves.
Should You Buy HBAR Now? Entry Strategy
The current technical setup suggests a buy or sell HBAR decision hinges on risk tolerance and time horizon. For aggressive traders, the current level near $0.11 offers a reasonable risk-reward setup with a tight stop-loss at $0.10.
Entry Strategy:
– Conservative entry: Wait for a break above $0.12 with volume confirmation
– Aggressive entry: Current levels around $0.11 with strict risk management
– Stop-loss: $0.0995 (below the 52-week low for cushion)
– Take-profit targets: $0.1160 (short-term), $0.14 (extended target)
Position sizing should remain conservative given the mixed technical picture and holiday trading conditions that could amplify volatility in either direction.
HBAR Price Prediction Conclusion
The HBAR price prediction for the next week points to modest upside potential targeting $0.1160, with medium confidence based on analyst consensus and oversold technical conditions. However, the Hedera forecast remains constrained by significant overhead resistance and weak longer-term trend structure.
Key indicators to monitor include RSI movement above 40 for confirmation of momentum shift, MACD line crossing above the signal line, and most importantly, a sustained break above the $0.12 resistance level with volume.
The prediction timeline suggests potential movement toward $0.1160 within 24-48 hours, but traders should remain cautious of the $0.10 support level, as a break below could invalidate the bullish thesis and trigger further downside toward new lows.
Confidence Level: MEDIUM – Technical indicators show mixed signals with modest bullish bias supported by oversold conditions and analyst consensus.
Image source: Shutterstock
Credit: Source link